
 568k
568k  233k
233k  41k
41k  Subscribe
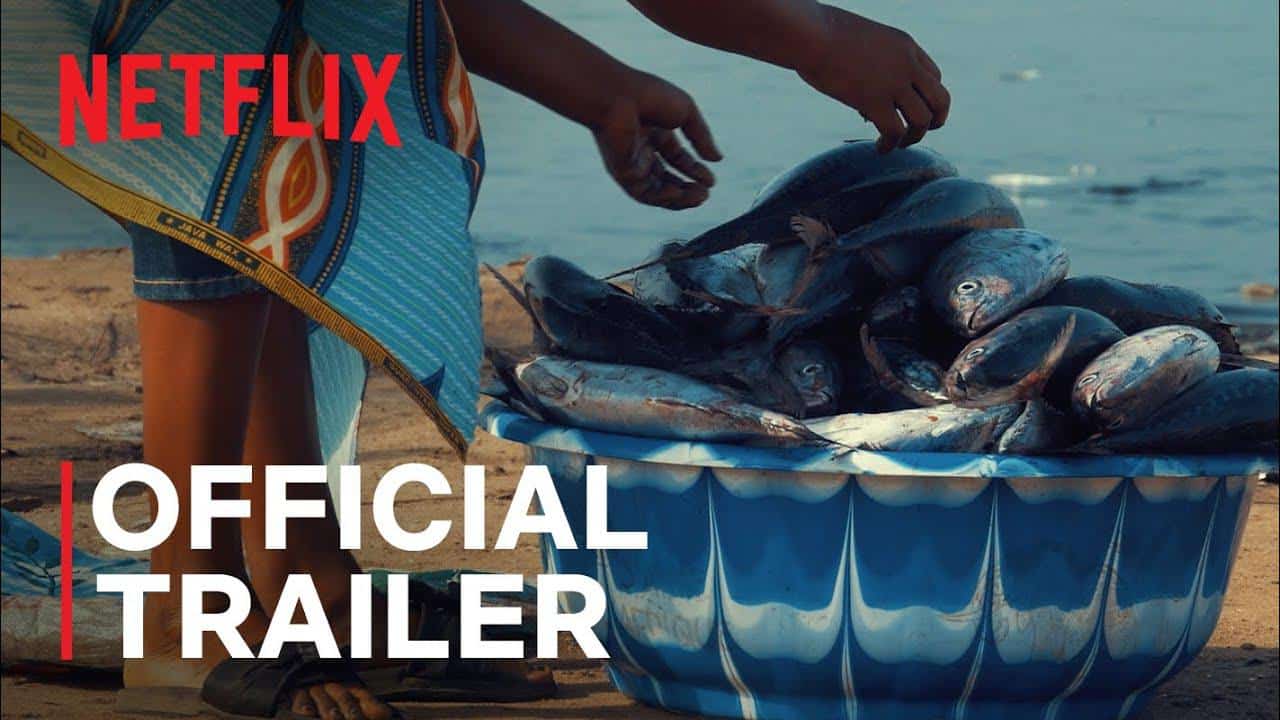
In his latest documentary, 27-year-old British filmmaker Ali Tabrizi calls out the commercial fishing industry for harming the oceans in the pursuit of fish. Since its release, the polarizing film has gone viral and climbed to Netflix’s top ten across the globe. The exposé has sparked countless questions about and investigation into the seafood industry’s claims and practices.
Tabrizi opens the film with scenes from his childhood. His love of the ocean came from watching orcas and dolphins perform in marine theme parks. As an adult, he came to understand the harm associated with captive mammals. The storyline quickly progresses to cover mass dolphin killing in Taiji, Japan along with overfishing for tuna. Everything is connected, and the chain of destruction goes on until “the documentary loses its shock factor” because “the bleak statistics cease to surprise,” reported The Independent. The message is clear: “we are destroying sea life at rapid speed.”
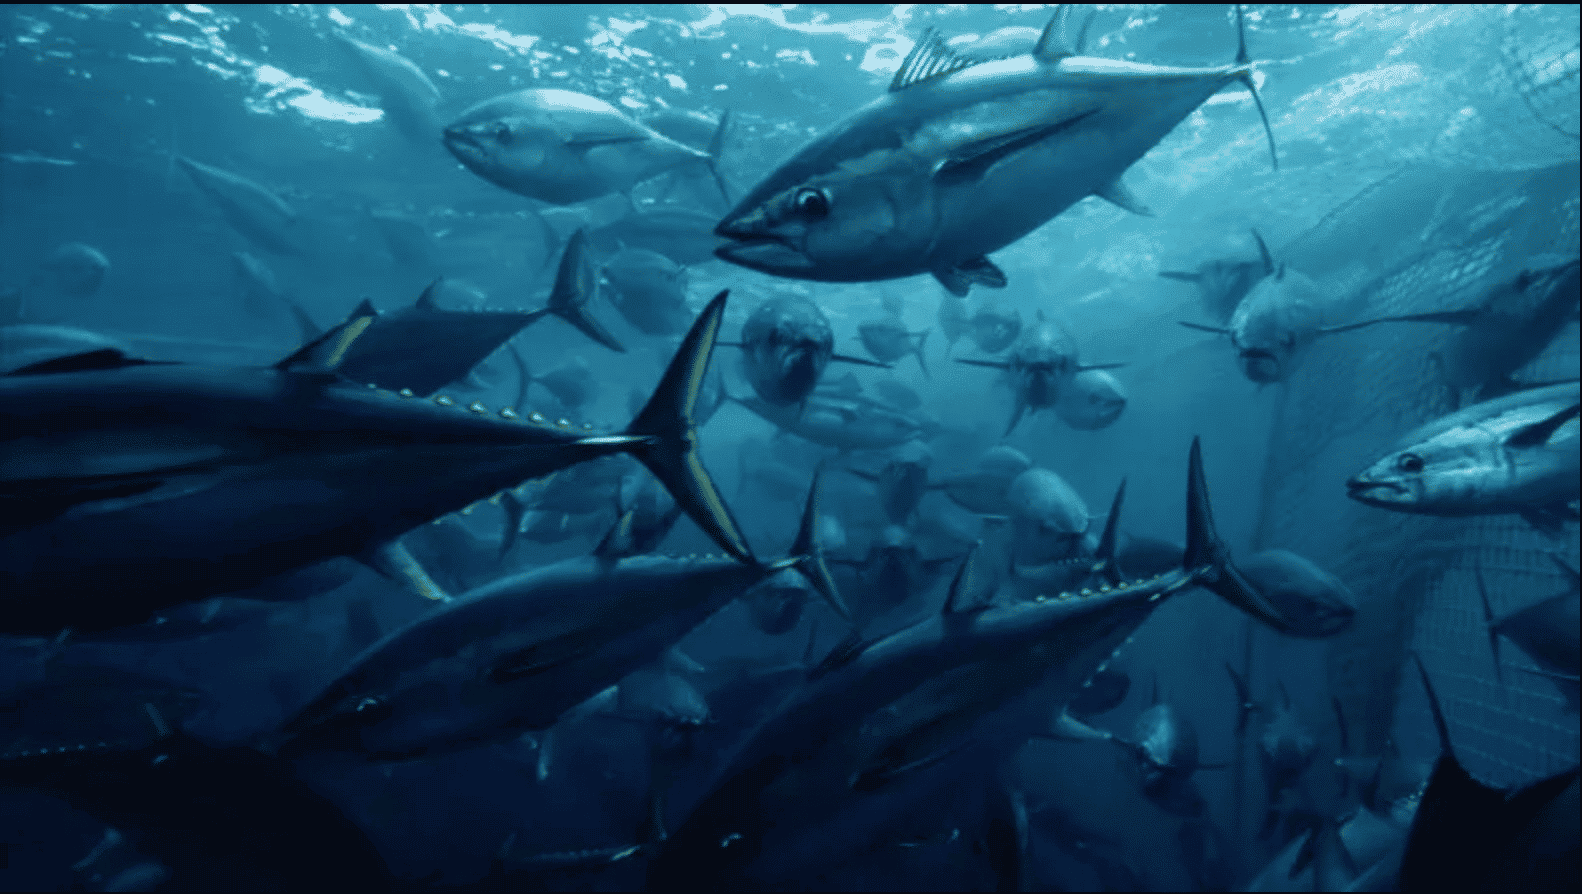
Seaspiracy alleges that overfishing for tuna helps keep demand and prices high. Netflix
In the film, Sylvia Earle, famed marine biologist and ocean explorer, warns that since humans excel at extracting enormous amounts of marine life from the sea, commercial fishing itself will go extinct because eventually there will be no fish left.
A Thrillist review said Seaspiracy connects all of the dots between commercial fishing, ocean destruction and slavery with a “wobbly line” and the “indictment of the myth of sustainability.”
With each new scene, Tabrizi reveals the fraud, corruption and greed currently destroying the oceans. Through figures and expert cameos, he claims:
- Discarded plastic fishing gear accounts for most ocean debris and is killing whales and other animals;
- The oceans will be emptied of fish in 27 years;
- Safe seafood labels are compromised by “pay-to-play” profit structures and lack enforcement;
- Overfishing is more damaging to the environment than deforestation;
- Farmed fish are disease-ridden, pollution-creating and resource-intensive;
- Thai fishing fleets use slave labor to remain profitable;
- “Sustainable seafood” is a myth; and
- The only solution is to stop eating fish.
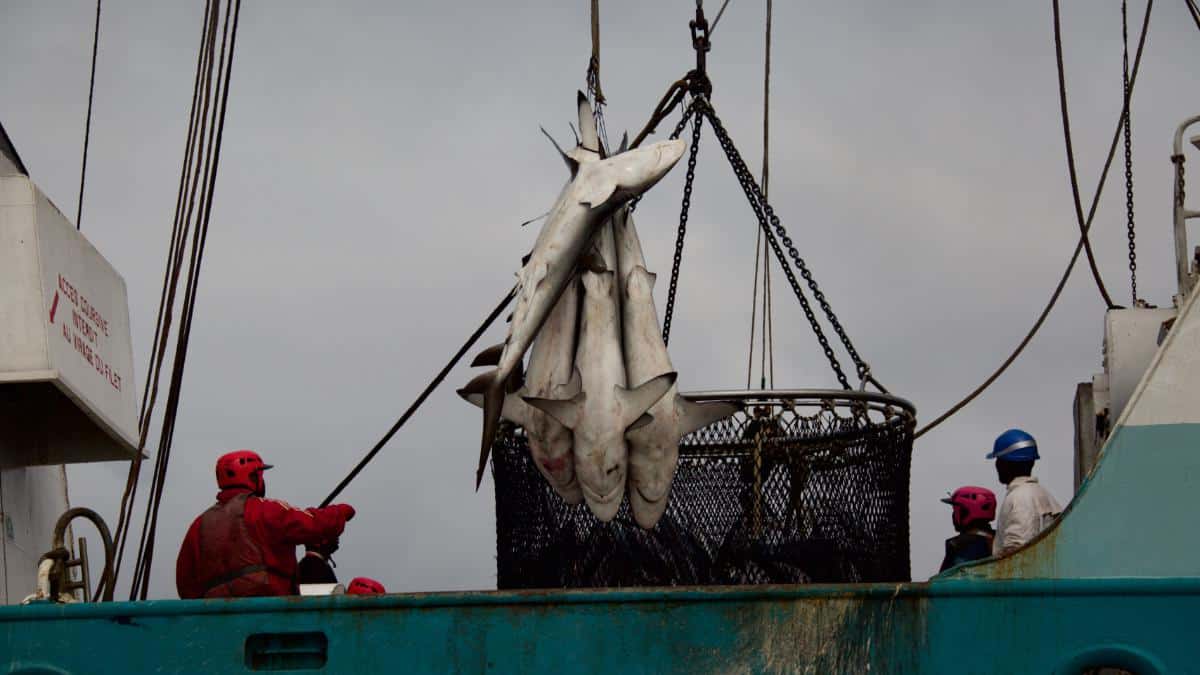
Shark bycatch is seen being dumped overboard in West Africa. Sea Shepherd
Tabrizi’s takeaway is a scathing condemnation of the multibillion-dollar seafood industry and the governments, groups and companies complicit with the ocean’s destruction. Seaspiracy calls for a collective shift away from eating seafood and toward vegan and plant-based alternatives.
“The amount of fish being taken out of the ocean is absolutely stunning — five million fish a minute,” Sea Shepherd Conservation Society Founder Capt. Paul Watson told EcoWatch. “We’re strip-mining life from the sea. There is no sustainable fishery anywhere on the planet.”
The marine conservation organization, known and sometimes criticized for its direct action techniques, features prominently in Tabrizi’s film. Tabrizi films from Sea Shepherd ships as they confront an illegal Chinese fishing vessel and encounter starving artisanal fishers in West Africa who have lost their jobs and food source to industrial fisheries.
When asked if the state of the oceans is as dire as depicted in Seaspiracy, Watson told EcoWatch, “I think it’s actually worse than presented in this film. For the most part, these problems are out of sight, out of mind. And, if the ocean dies, we die.”

The Sea Shepherd fleet of ships patrols the world’s waters. Thomas Le / Sea Shepherd
To date, millions have watched the documentary, and reactions from viewers and marine organizations run the gamut.
“I think it was a brilliant film,” Watson said. “It’s the first opportunity to get the message out about what’s happening in our oceans. Many people are being confronted with information that they never paid attention to before.”
One Twitter user agreed, saying, “So modern fishing with nets large enough to sweep up cathedrals is wiping out ocean ecosystems which we rely on to regulate the planet. We are literally killing ourselves….” Another user urged, “Do watch it if you care about oceans/fish. I’m gonna stop eating fish, starting today. A must watch.”
Critics of the film have also been vocal, denouncing the underlying facts presented, the film’s possible vegan agenda and its reductionist and sensationalist approach, Global Aquaculture Alliance reported. The New York Times likened the tone to “a cheap imitation of hard-hitting investigative journalism” full of “conspiratorial thinking.” Some accused the film of perpetuating a “white savior complex,” The Independent reported.
Leading seafood certification group Marine Stewardship Council (MSC), a target throughout the documentary, refused Tabrizi’s numerous interview requests. After the documentary’s release, MSC agreed that, “There is a crisis in our oceans, and an urgent need to end overfishing.” The organization also rebutted, “… it is wrong to claim that there is no such thing [as] sustainable fishing and that the only solution is to stop eating fish. Some of the problems that the film highlights — bycatch, overfishing and destruction of marine ecosystems — are precisely the issues the MSC certification process is designed to address.”
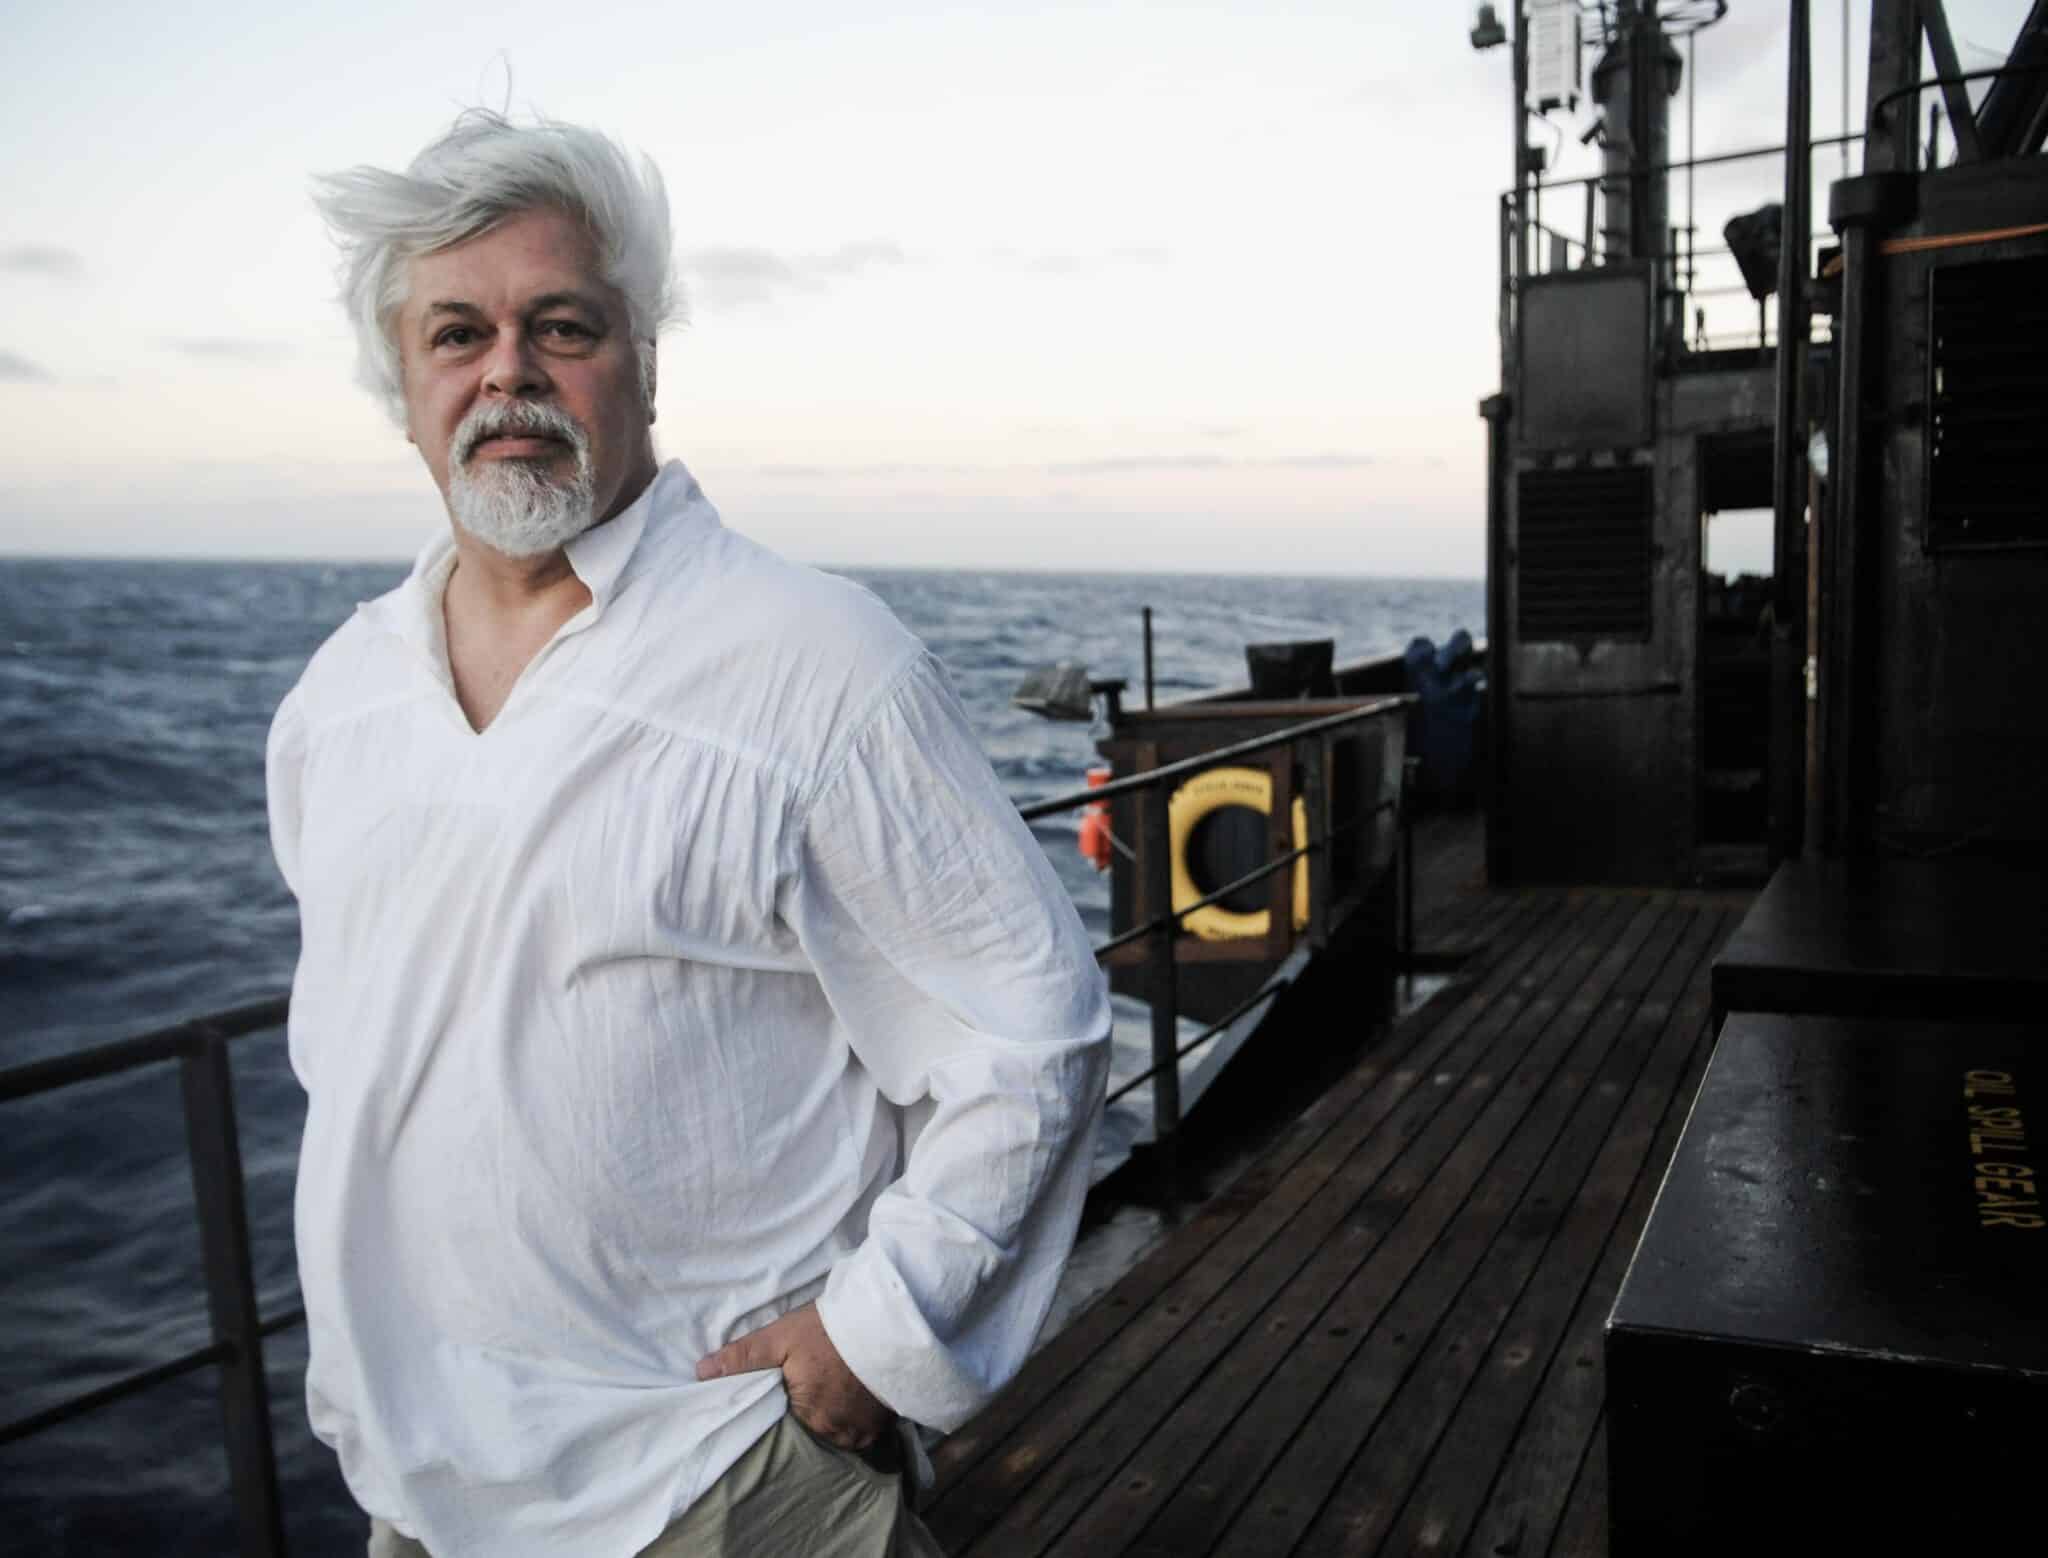
Sea Shepherd Founder Paul Watson considers commercial fishing the biggest threat to the future of the oceans. Sea Shepherd
Mark J. Palmer, who is connected to the Earth Island Institute, the firm that manages the “dolphin-safe” label for tuna, is featured in a pivotal scene in the film. On camera, Tabrizi asks Palmer whether he can guarantee that all tuna cans labeled dolphin-safe caused no harm to dolphins. The latter responds, “Nope. Nobody can,” and justifies his answer by saying, “Once you’re out there in the ocean, how do you know what [fishermen are] doing? We have observers onboard — observers can be bribed and are not out on a regular basis.”
Palmer has since tried to dampen his statement and suggests that Seaspiracy took his remarks out of context, IntraFish, a seafood news site, reported. Newsweek fact-checked the film’s claims and Palmer’s defenses and concluded that “[b]ased on comments made by the Earth Island Institute and other experts, it is not possible to say whether all canned tuna that is labeled ‘dolphin-friendly’ is guaranteed to have not harmed dolphins in the fishing process.”
Regardless of whether or not they are fans of the film, most conservationists and scientists agree that the oceans matter in the fight against the climate crisis, both for providing food security for millions worldwide along with protecting cultural ways of life.
According to The Guardian, Callum Roberts, a marine conservationist featured in Seaspiracy, offered this conclusion for the film’s critics: “My colleagues may rue the statistics, but the basic thrust of it is we are doing a huge amount of damage to the ocean and that’s true. At some point, you run out. Whether it’s 2048 or 2079, the question is: ‘Is the trajectory in the wrong direction or the right direction?'”
- Indian Ocean Dolphin Population Plummets Due to Commercial ...
- Global Fish Stocks Depleted to 'Alarming' Levels - EcoWatch
- Trump Opens Marine Sanctuary to Commercial Fishing - EcoWatch
- Marine Life Is Fleeing the Equator to Cooler Waters – This Could Trigger a Mass Extinction Event
- Sea Shepherd and Peruvian Government Intercept Illegal Fishing Vessels
- Sea Shepherd Finds Endangered Amazonian Dolphins Dead and Possibly Harpooned During Scientific Expedition - EcoWatch