
 568k
568k  233k
233k  41k
41k  Subscribe

By Jeremy Deaton
President Trump‘s proposed 2019 budget would slash funding for NASA’s Earth Science Division, and while his budget hasn’t gained traction in Congress, it is an important statement of the administration’s priorities. In a nod to his allies in the fossil fuel industry, Trump is calling for the elimination of vital programs that monitor carbon pollution and climate change.
Critics say NASA’s Earth Science Division is a waste of taxpayer dollars and a distraction from the agency’s core mission of space exploration. But NASA has a critical role to play in understanding human-caused climate change, by operating satellites that monitor the earth’s forests, deserts, oceans and atmosphere.
NASA scientists are working to improve our understanding of natural disasters like wildfires, hurricanes and drought, while tracking long-term changes to the earth’s climate. Researchers are also mapping out those changes so Americans can understand how heat-trapping carbon pollution is reshaping the world. Below is a collection of NASA maps, graphs and photos cataloging this profound transformation.
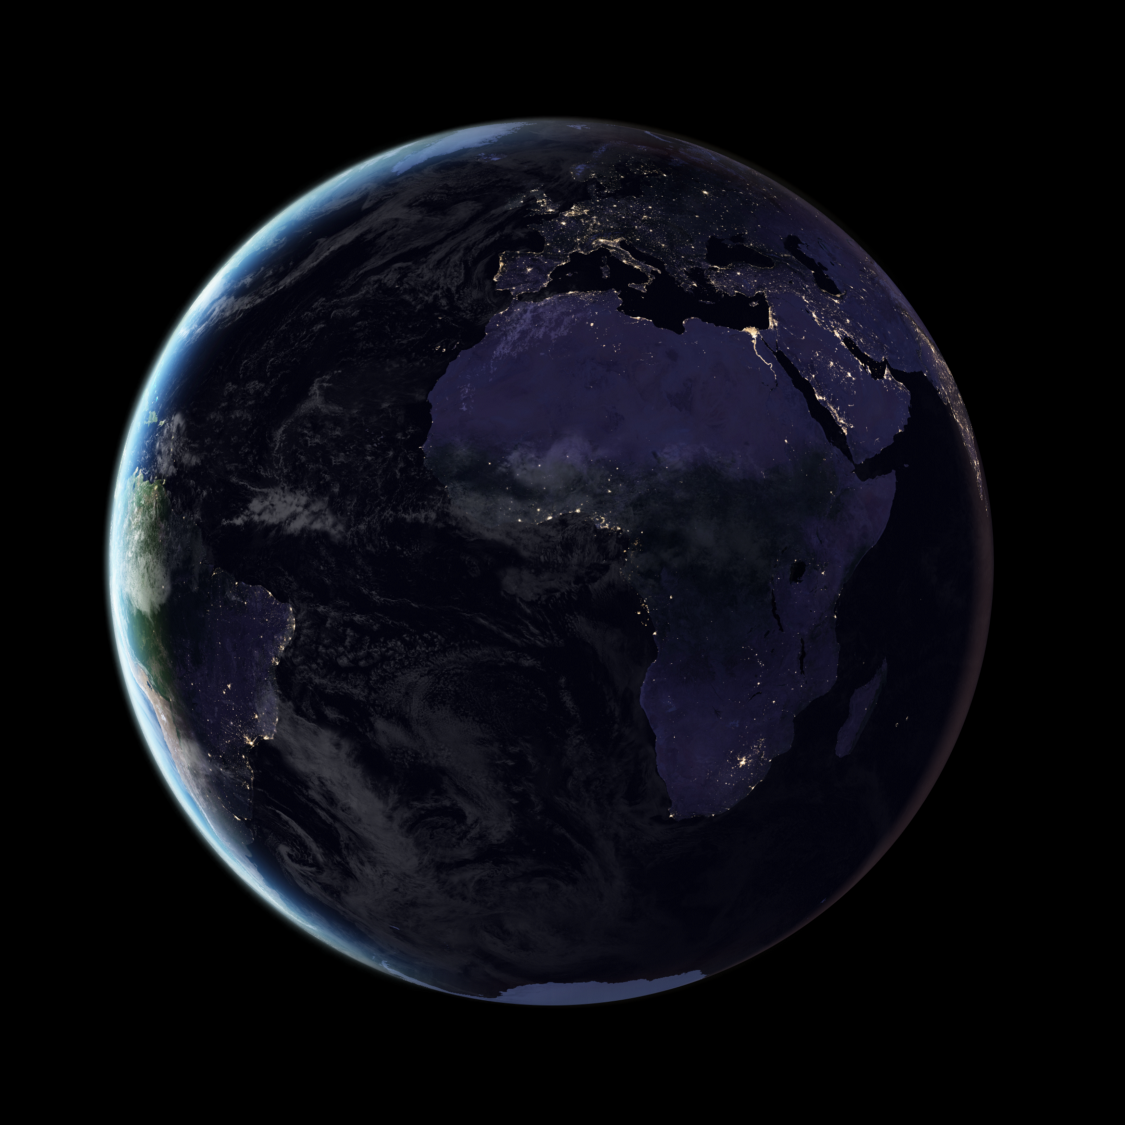 A computer rendering of the earth at night based on satellite images. Source: NASA
Causes of Climate Change
It’s part of NASA’s mission to understand the balance of energy on Earth—how much of the sun’s energy is absorbed by the earth and how much of it is reflected back out to space. Over the last century, the earth has retained more and more of the sun’s energy, causing the planet to warm around 1°C.
Warming is not explained by changes in solar activity or changes in the earth’s orbit, nor is it explained by changes in volcanic activity. What about human factors? Changes in land use—converting forests to farms and pastures—have had a slight cooling effect, as dark green woodlands are replaced by tawny-colored fields of wheat and grass, which reflect more of the sun’s light. Ground-level ozone pollution makes the earth a little warmer, but not much. Aerosols, another form of pollution, actually cool the atmosphere.
The evidence shows that greenhouse gases are responsible for the warming trend. Carbon pollution is trapping more of the sun’s heat. That carbon pollution primarily comes from burning coal, oil and gas to generate energy. It also comes from raising livestock—mostly cows and sheep—that expel methane, a powerful heat-trapping gas, and from burning forests. While converting dark-colored forests to bright-colored farmland has a small cooling effect, lighting trees on fire also releases a tremendous amount of heat-trapping carbon pollution into the sky. Trees scrub carbon dioxide from the air. When set aflame, they dump that carbon back into the atmosphere.
 Human contributions to climate change, including land use changes, ozone emissions, aerosol emissions and greenhouse gas emissions. Greenhouse gas emissions are responsible for the warming trend. Source: NASA / Bloomberg
The line graph below shows how quickly carbon dioxide is gathering in the atmosphere, rising from 370 parts per million in 2000 to more than 400 parts per million today, as measured by the Mauna Loa Observatory in Hawaii. The map shows the changing concentration of carbon dioxide in the earth’s atmosphere, as measured by satellite, shifting from green to yellow to orange to red as the concentration increases. Cars, trucks, factories and power plants in the U.S., Europe and China are responsible for most of the pollution.
 The line graph shows the atmospheric concentration of carbon dioxide as measured at the Mauna Loa Observatory in Hawaii, from 2000 to 2015. The map shows the distribution of added carbon dioxide over the same period, according to satellite data. Warmer colors indicate more carbon dioxide. Source: NASA
The concentration of carbon dioxide rises and falls each year, even as the total concentration inches up over time. That’s because every spring and summer, trees in the Northern Hemisphere—home to most of the world’s land mass—sprout leaves that soak up atmospheric carbon dioxide. In the fall, those trees shed their leaves, which decay, releasing carbon dioxide back into the air. The animation below shows the change of seasons across several years. When summer arrives in North America, leaves sprout and ice recedes in North America. At the same time, trees south of the equator lose their leaves.
 Seasonal changes in vegetation. Source: NASA
The world’s carbon output has grown in recent years, but there has also been a shift in where that carbon pollution is coming from. The U.S., Europe and Japan have seen declining pollution, thanks in large part to limits on pollution. In China, India and the Middle East, pollution has increased as those countries open more factories, fire up more power plants and put more cars on the road. In addition, numerous companies in the U.S. and Europe have moved manufacturing operations to China, effectively exporting the pollution associated with those operations.
The map below shows changes in emissions of nitrogen dioxide from 2005 to 2014. Nitrogen dioxide isn’t a heat-trapping gas like carbon dioxide, but it is a dangerous pollutant that can make it harder to breathe. Areas with little nitrogen dioxide pollution are colored in blue. Areas with more pollution are colored in yellow, while areas with the most pollution are colored in red.
 Nitrogen dioxide pollution from 2005 to 2014. Cooler colors indicate less pollution. Warmer colors indicate more. Pollution declined in the U.S. and Europe and increased in China. Source: NASA
The rapid growth of China looks even more dramatic when viewed up close. The satellite images below shows how Shanghai has changed between 1984 and 2016 as more companies set up factories and workers moved from rural areas to work in those factories. The population of the city roughly doubled in that time.
 Shanghai, China from 1984 to 2016. Source: NASA
Industrialization isn’t the only trend driving the rise in temperature. As mentioned above, there’s also deforestation. The map below shows declining forest cover in Rondônia in western Brazil between 2000 and 2010. Settlers build roads into remote parts of the Amazon rainforest, burning forests near those roads to clear land for crops and cattle.
 Rainforest loss in Rondônia, Brazil from 2000 to 2010. The area shown is roughly 100 miles across. Source: NASA
All together, these trends—industrialization, deforestation, growing consumption of meat—are producing dramatic changes in the earth’s climate and, by extension, are fueling heat, drought and severe storms.
Symptoms of Climate Change
The most obvious symptom of all that carbon pollution is a rise in the average surface temperature of the earth. The map below is based on temperature from thousands of weather stations, ships, buoys and research outposts collected over more than a century. It shows the how much temperatures have differed from the mid-20th-century average. Blue areas are unusually cold. Orange areas are unusually hot. As the map progresses from 1880 to 2016, temperatures grow warmer across the globe.
 Global temperature anomaly from 1880 to 2016. Warm colors indicate temperatures above than the 1951–1980 average. Cool colors indicate temperatures below that average. Source: NASA
It’s notable that temperatures aren’t rising uniformly. As shown in the map above, the Arctic is warming roughly twice as fast as the rest of the globe. This is partly the result of weather patterns that carry warm air to the North Pole, but it is also a function of melting sea ice. White sea ice reflects the sun’s light, keeping the region cool. When it melts, it is replaced by dark water, which absorbs the sun’s light, accelerating warming.
The map below, based on satellite measurements, shows the decline of Arctic sea ice between 1984 and 2016. Younger ice is shown in dark blue. Older ice is shown in gray or white. Every summer ice melts, and every winter it forms again, but the long-term rise in temperature means that the total stock of ice is declining over time as old sea ice disappears into the sea.
 Arctic sea ice 1984 to 2016. Lighter colors indicate older sea ice. Darker colors indicate younger sea ice. from Source: NASA / JAXA
The decline of sea ice is of virtually no consequence for sea levels. (Think of the ice in a glass of water which, when melted, does not cause the glass to overflow.) What is of greater concern, however, is the melting of the Greenland ice sheet, a mile-thick block of ice that would raise sea levels by more than 20 feet if it were to melt completely. The map below, based on satellite data, shows the melting of the Greenland ice sheet between 2002 and 2016. Snowfall is causing the ice sheet to gain a small amount of mass in the center of the island, but rising temperatures are melting the outside of the ice sheet much faster, as pools of water form atop the island and drain out to sea.
 Ice lost from Greenland from 2002 to 2016. Warm colors indicate more ice loss. Cool colors indicate the accumulation of ice. Source: NASA
Antarctica is undergoing similar changes, though it is losing ice about half as quickly as Greenland. Antarctica, however, is home to considerably more ice. If all the ice on the continent were to melt, it would raise sea levels by some 200 feet. Currently, much of the ice on Antarctica is being kept at bay by floating ice shelves, shown in gray on the map below. If these ice shelves break apart, ice from the continent will begin to slide into the ocean.
 Antarctic ice loss from 2002 to 2016. Warm colors indicate more ice loss. Cool colors indicate the accumulation of ice. Source: NASA
Together, Greenland and Antarctica are pouring billions of tons of water into the world’s oceans each year, but ice melt is only one factor in sea-level rise. Warmer temperatures also play a role. As seawater heats up, it expands, causing water levels to rise. For this reason, sea levels haven’t risen uniformly across the globe. Where waters have warmed faster, such as in the South Pacific, the sea has crept up more. In the North Atlantic, climate change has cooled waters by slowing the Gulf Stream, causing sea levels to drop. The map below, based on satellite data, charts sea-level rise from 1992 to 2014. Warm colors indicate more sea-level rise, while cool colors indicate a drop in sea level.
 Sea-level rise from 1992 to 2014. Warm colors indicate more sea-level rise, while cool colors indicate a drop in sea level. Source: NASA
Melting ice and rising seas aren’t the only symptoms of climate change. Warmer temperatures are also fueling extreme weather. Last year produced several notable examples in the U.S. The satellite images below, based on infrared data, show Southern California before and after the December 2017 Thomas Fire, the largest wildfire in California history. The maps have been colored to show the extent of the damage. Hotter, drier weather is making wildfires more likely.
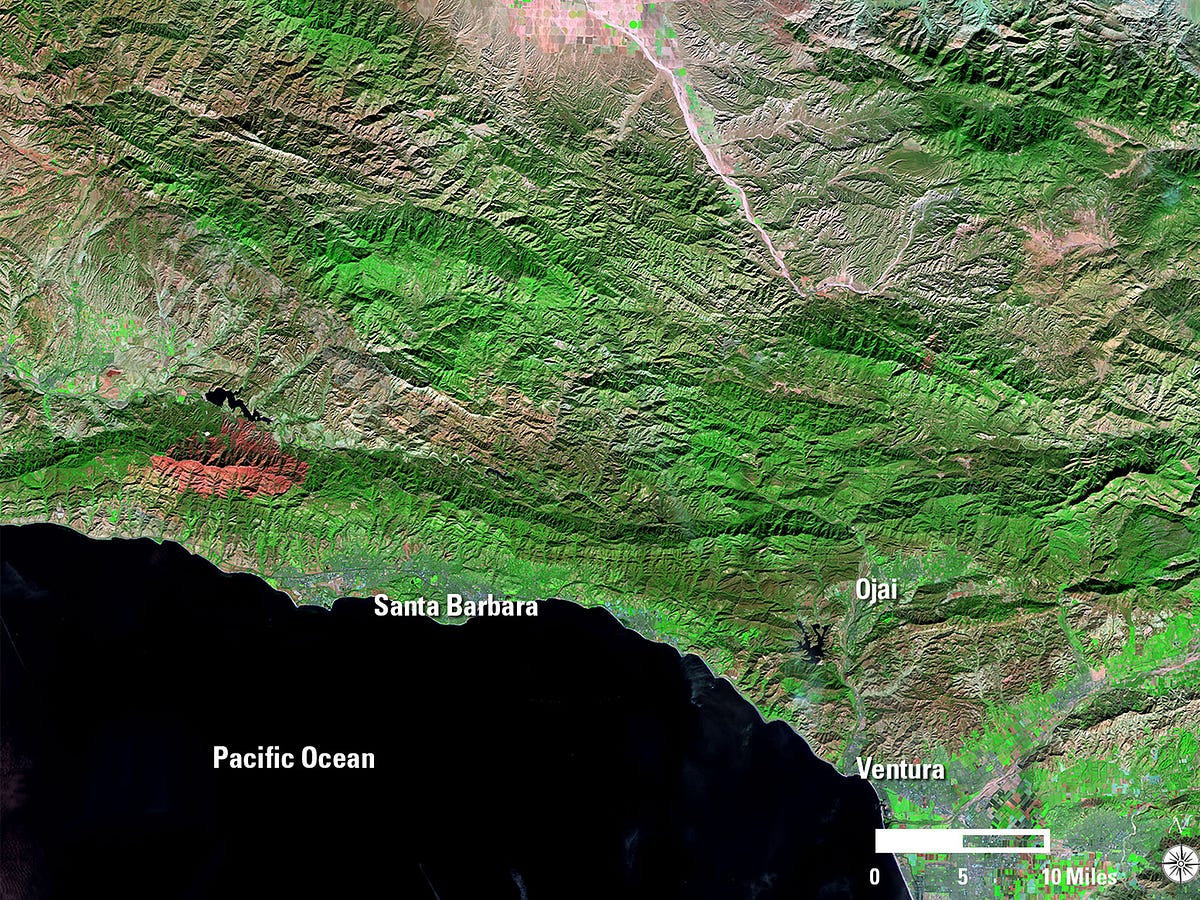
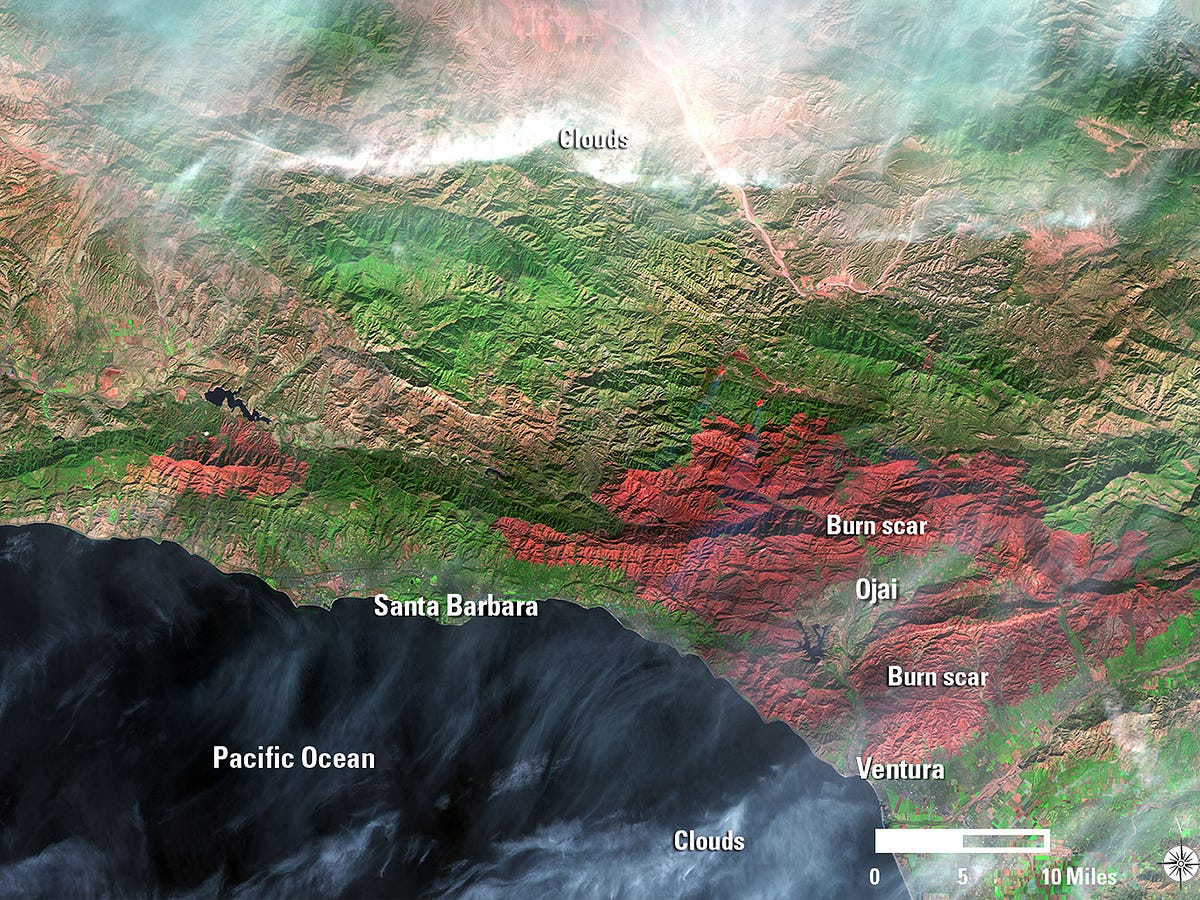 Southern California before (top) and after (bottom) the December 2017 Thomas Fire, the largest wildfire in the state’s history. Burned areas have been colored red. Source: NASA / USGS
Persistent heat and erratic rainfall are also fueling drought. Warm weather dries up lakes and rivers, desiccates soil, and prematurely melts reserves of snow that supply freshwater during the spring and summer. In the absence of consistent rainfall, water levels drop lower and lower. The satellite images below show Lake Mead, which lies on the border between Nevada and Arizona, in 1984 and today. Lake Mead is the largest water reservoir in the U.S.
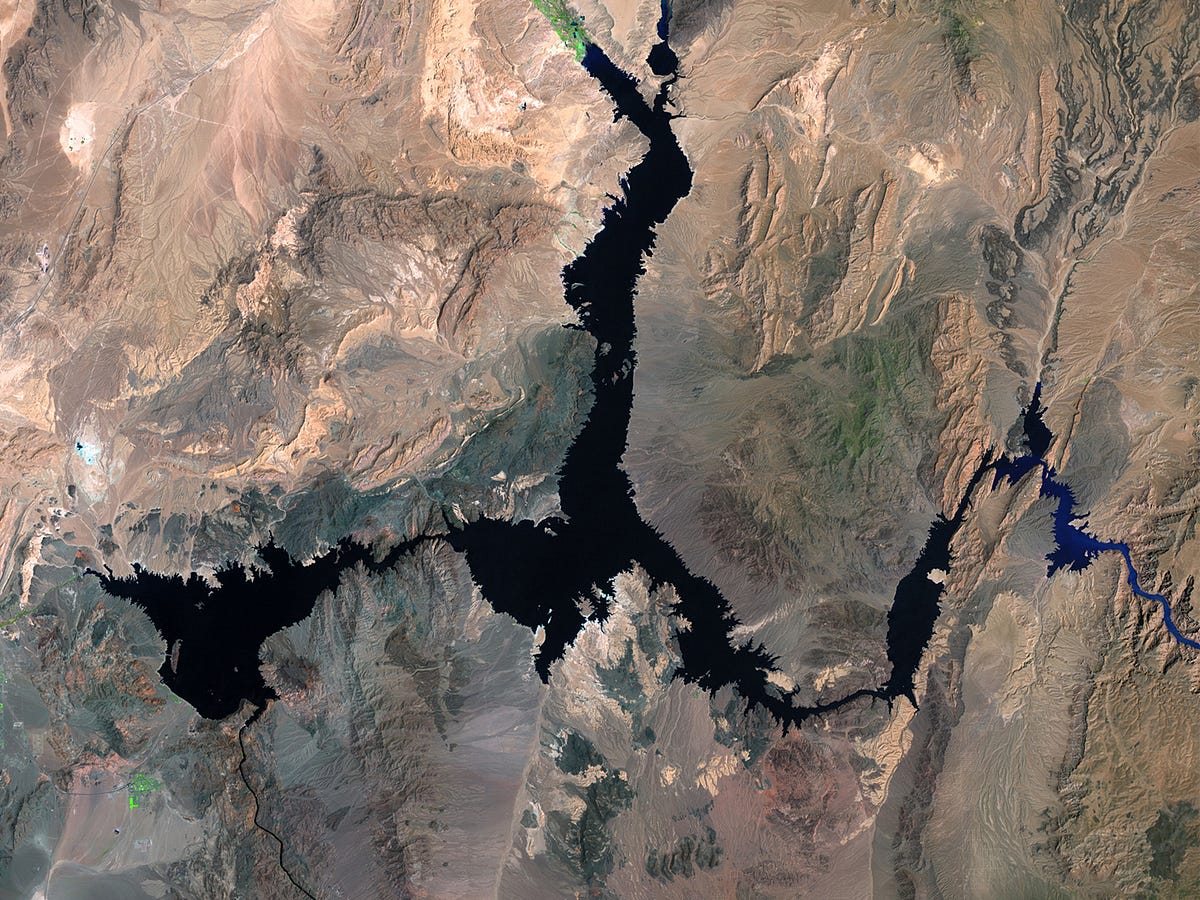
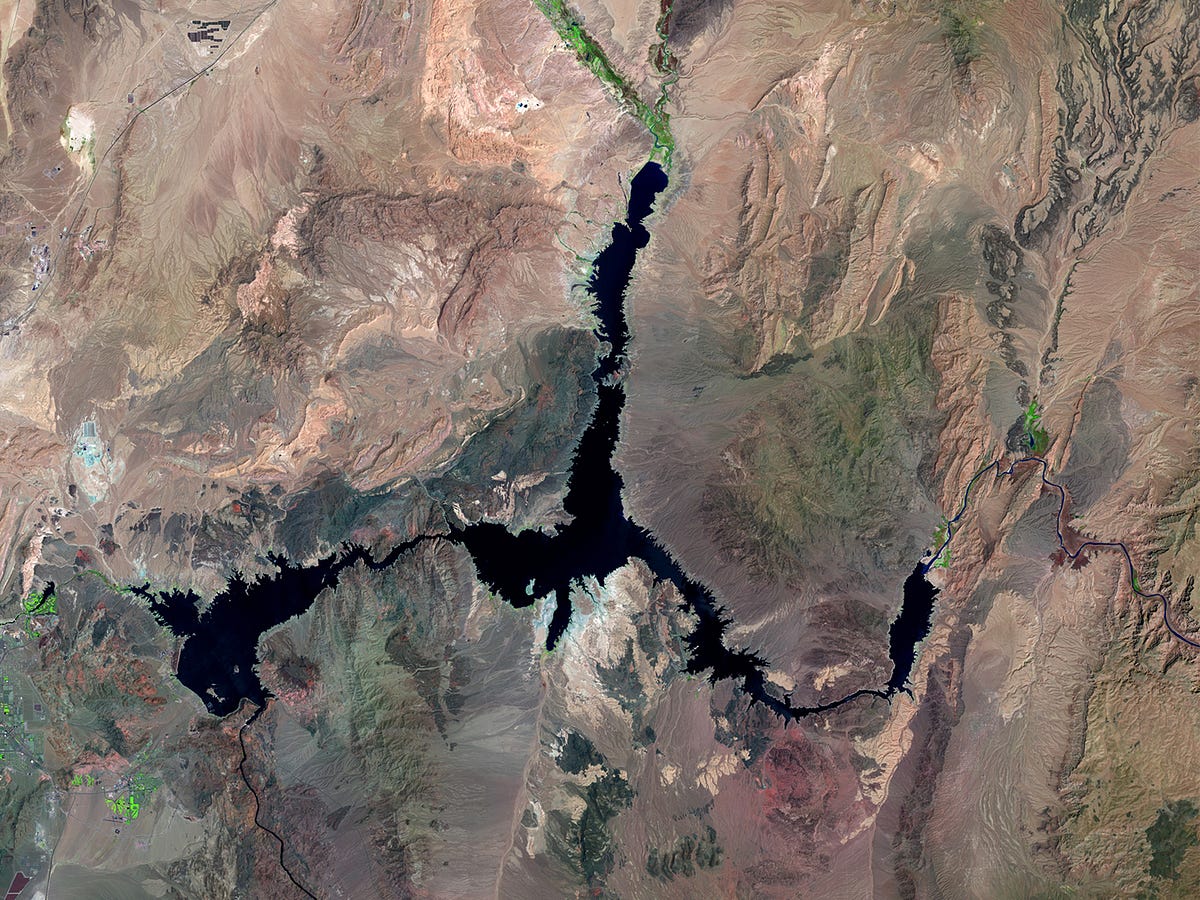 Lake Mead in 1984 (top) and 2016 (bottom). Hot, dry conditions have caused water to evaporate. Source: NASA / USGS
Just as climate change is fueling drought, it is also fueling heavy precipitation. As the atmosphere warms, it retains more moisture, producing less frequent rainfall, but heavier downpours. The satellite images below show parts of Missouri, Illinois and Kentucky before and after a period of intense rainfall in the spring of 2017. Some areas saw more than 9 inches of rain and floods that broke records that had stood for more than a century. The maps have been colored to show the extent of the flooding, shown in dark blue.

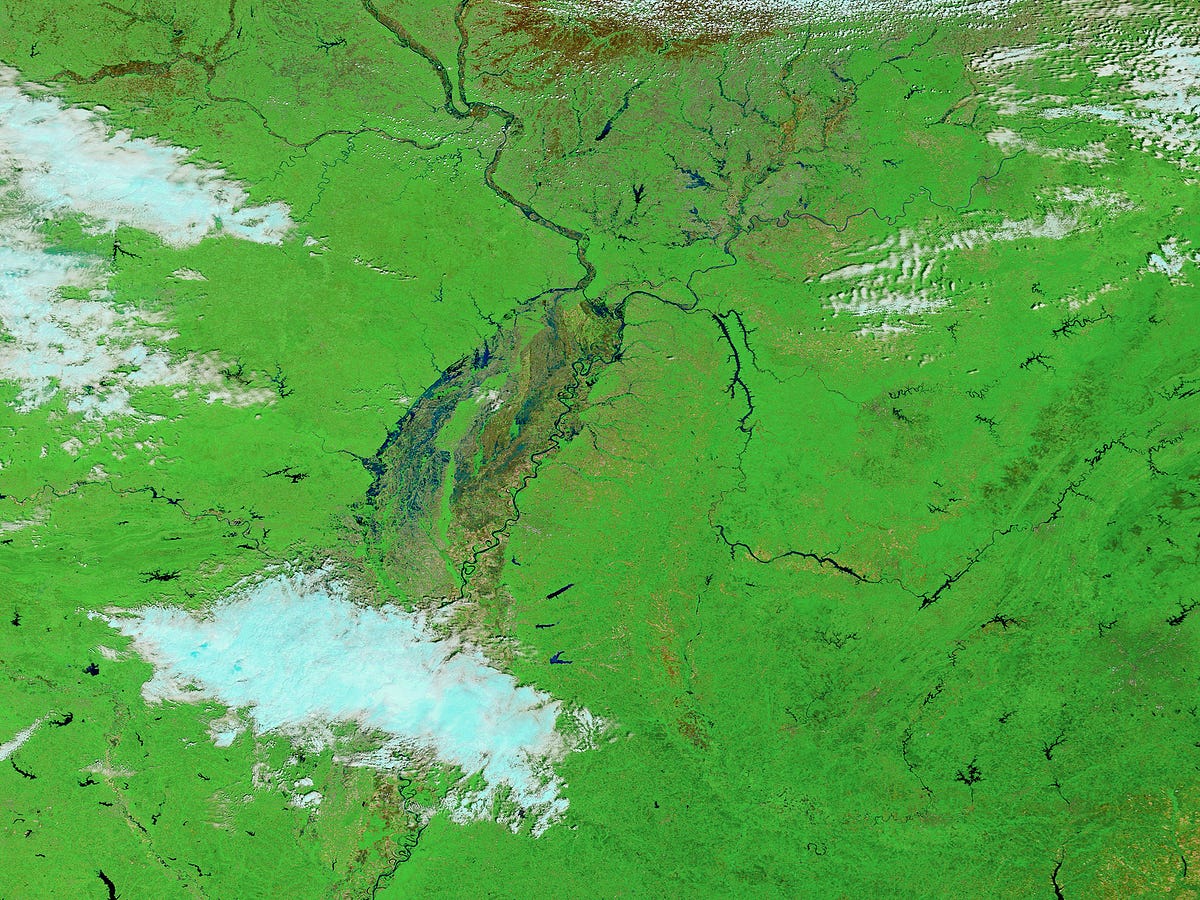 The central and southern U.S. before and after a period of intense rainfall from April 29 to May 1, 2017 produced record-breaking floods. Flooded areas have been colored dark blue. Source: NASA
Rising temperatures are also raising the speed limit for tropical cyclones, as warmer ocean temperatures fuel faster wind speeds. Hurricane Irma, for example, delivered winds of 185 mph, prompting some to call for a new category of hurricane to describe the more dangerous storms made possible by climate change. The satellite image below shows Hurricane Irma, along with Hurricane Katia and Hurricane Jose in September 2017, the first time in recorded history the Atlantic hosted three tropical cyclones, each of which threatened to make landfall.
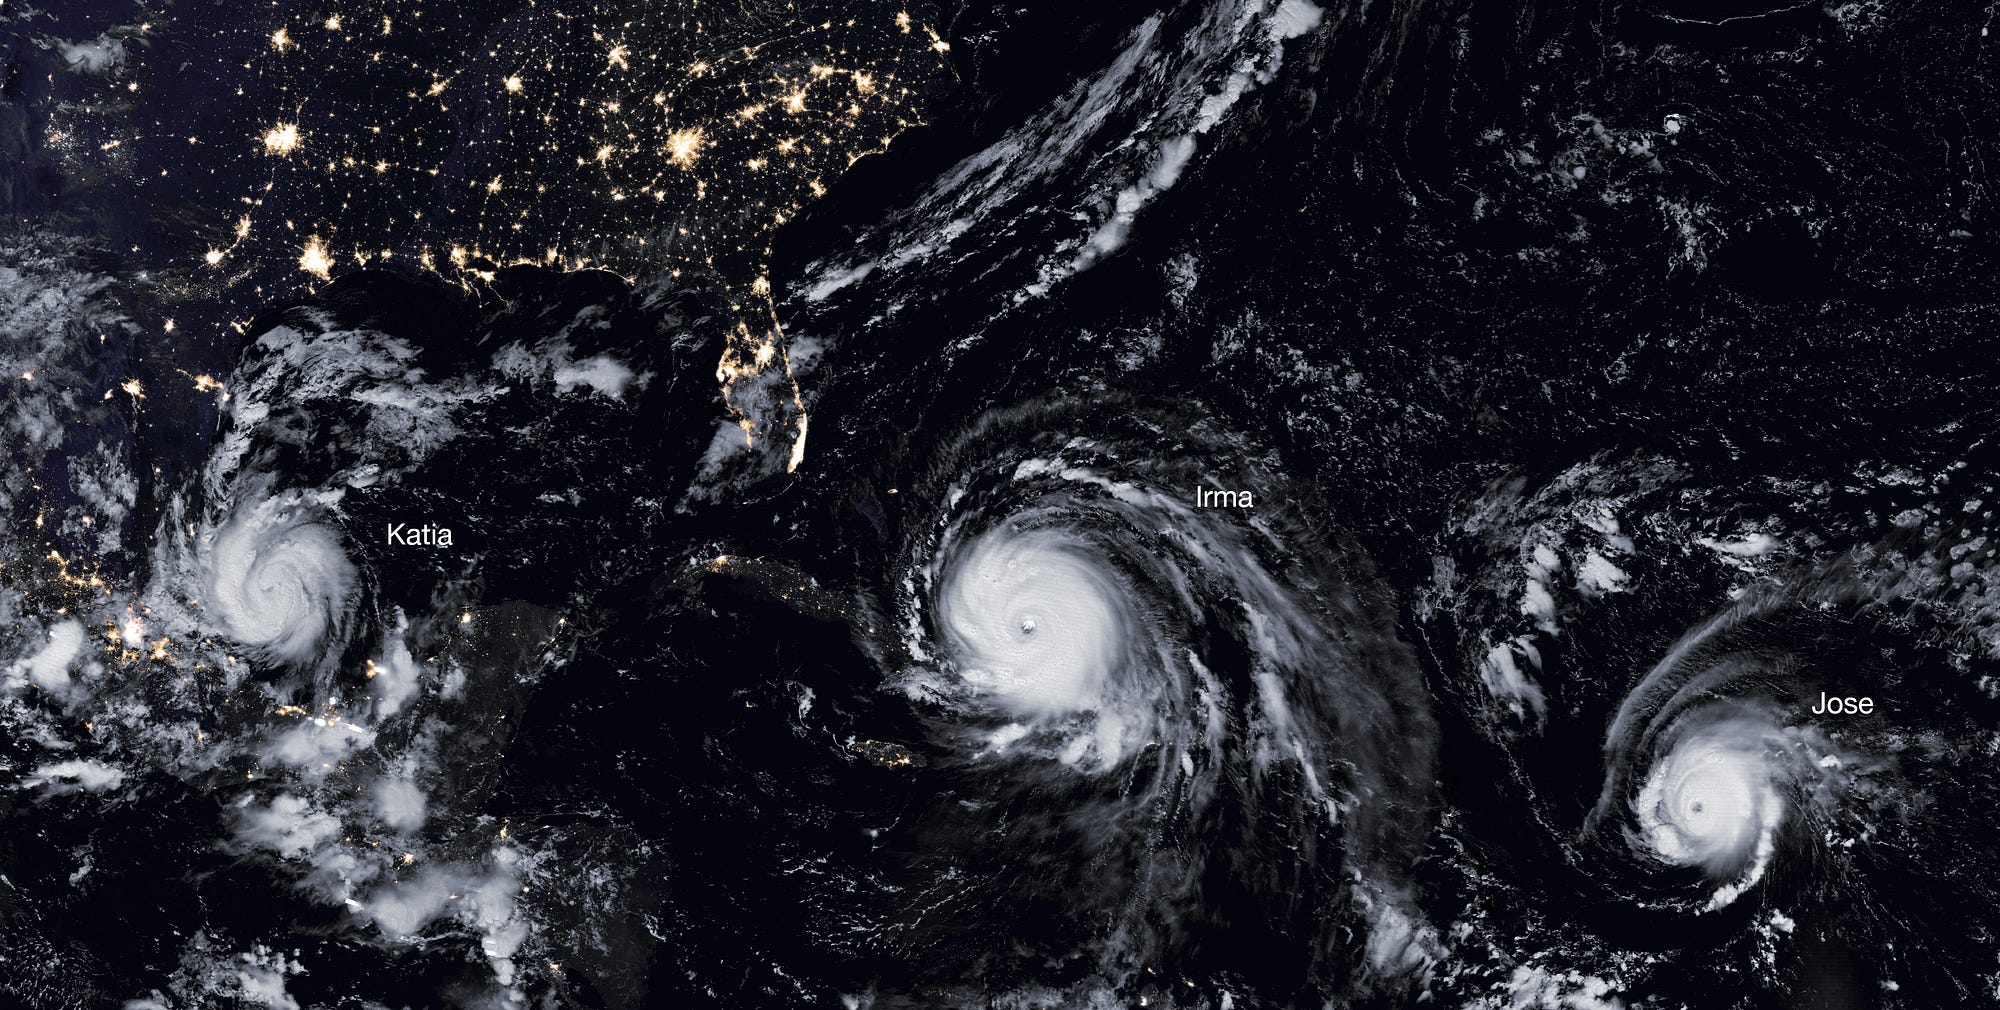 Hurricane Katia, Hurricane Irma and Hurricane Jose in September 2017—the first time in recorded history the Atlantic hosted three tropical cyclones in danger of making landfall. Source: NASA
Last year saw several other notable storms, including Hurricane Harvey, which devastated Houston, and Hurricane Maria, which laid waste to Puerto Rico. All told, 2017’s natural disasters were the most expensive in U.S. history, inflicting more than $300 billion in damage. For context, NASA spends less than $2 billion annually on earth science.
A Reason for Hope
Climate change is an impossibly big, unthinkably difficult problem. Halting the warming trend requires nothing short of the total transformation of the global energy system, as well as significant changes to the way we work, eat and travel. But there is some (small) precedent for success.
In 1987, countries around the world agreed to the Montreal Protocol, a treaty to limit the use of the chemicals that were punching a hole in the ozone layer. At ground level, ozone is harmful to human health, but high above the surface of the earth, it blocks harmful, ultraviolet rays that can cause skin cancer in humans and reproductive problems in small, aquatic animals. In 1992, President George H.W. Bush ordered U.S. manufacturers to phase out the use of these substances. Other world leaders did the same, and it worked.
The maps below chart changes in the ozone layer from 1974 to 2065. The map on the left shows the world we live in—what the ozone layer looked like up until today, and what scientists expect it will look like in the years ahead, given the global ban on ozone-depleting pollutants. The map on the right shows how the ozone layer would have looked if policymakers had done nothing. Both maps are based on a computer model using satellite data. Warmer colors indicate more ozone, while cooler colors indicate less ozone.
 The map on the left shows projected changes to the ozone layer, given policies to limit the use of chemicals that deplete the ozone layer. The map on the right shows what the ozone layer likely would look like if governments took no action. Warmer colors indicate more ozone, while cooler colors indicate less ozone. Source: NASA
As the maps make clear, smart policy can stave off environmental catastrophe. If countries had done nothing, the ozone layer would be almost totally depleted by the end of this century. It’s why former UN Secretary-General Kofi Annan has said the Montreal Protocol is “perhaps the single most successful international agreement to date.”
It’s important to note that our understanding of the ozone layer is based in large part on NASA research. The same is true of other environmental challenges, including climate change. As the agency’s former chief climate scientist, James Hansen, explained, “Being at NASA and having the access to both computing capability and satellite observation capability is kind of the ideal research situation to try to understand global climate change.” Without NASA research, it would be much, much harder to understand—and tackle—the problem.
New NASA Study Solves Climate Mystery, Confirms Methane Spike Tied to Oil and Gas https://t.co/dGVGRws5Ce @NASA @UCSUSA @NRDC @350 @SierraClub @ClimateReality @climatehawk1 #methane #climate #MethaneEmissions
— EcoWatch (@EcoWatch) January 16, 2018
Reposted with permission from our media associate Nexus Media.