
 568k
568k  233k
233k  41k
41k  Subscribe
SimonSkafar / E+ / Getty Images
A powerful documentary can help inform viewers and spark a more conscious lifestyle. Maybe you’ve thrown out rotting greens one too many times, or waste from online shopping has you feeling guilty. The following list of documentaries may inspire you to “green” your life a bit more.
From a Sir David Attenborough Netflix series to a food waste documentary produced by the late Anthony Bourdain, these five environmental documentaries are an absolute must-watch.
1. Our Planet (2019)
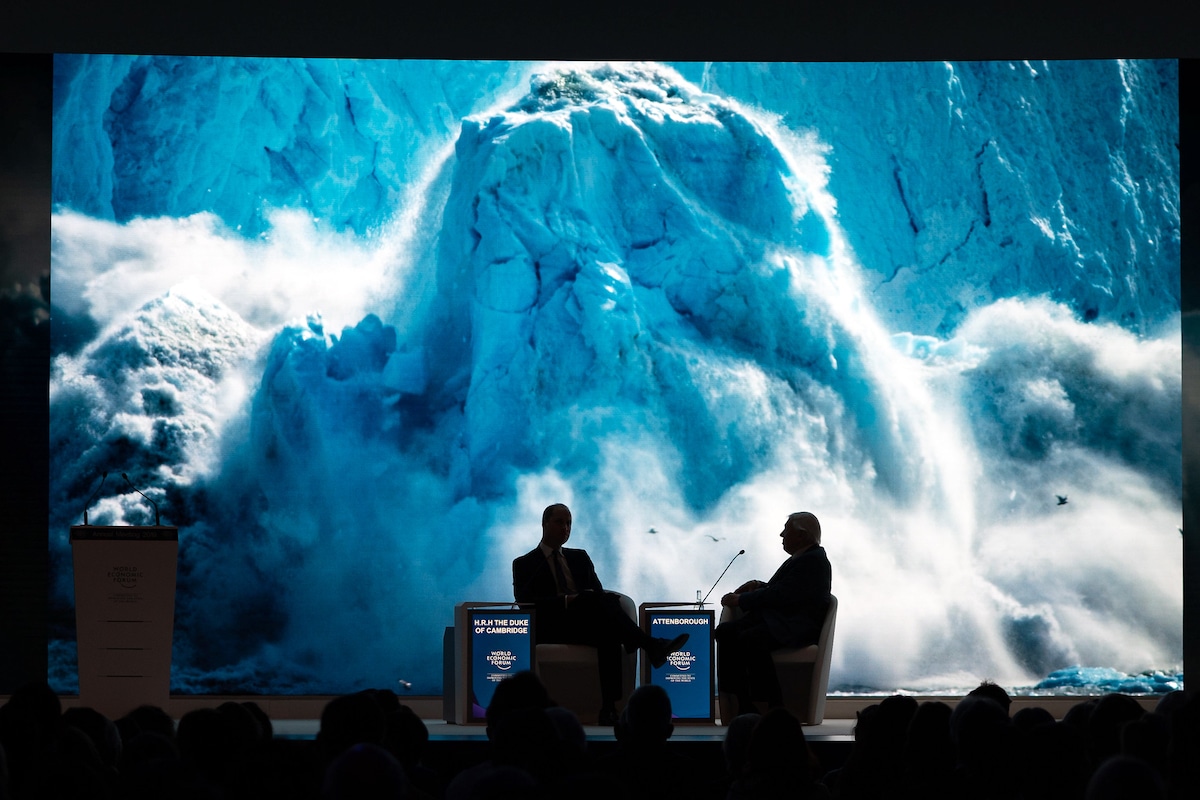
Our Planet is a Netflix original nature docuseries. Narrated by Sir David Attenborough, this is the first of his series to appear exclusively online.
How to watch:
Stream all episodes on Netflix.
Want to know more?
You might like this article from The Atlantic: Netflix’s Our Planet Says What Other Nature Series Have Omitted Says What Other Nature Series Have Omitted.
2. The End of Meat (2017)
After sold-out premieres worldwide, German Filmmaker Marc Pierschel’s The End of Meat launched worldwide in March. The documentary exposes the brutal impact of meat consumption, while also exploring what a shift to a more compassionate diet can look like.
How to watch:
The End of Meat is available to stream on iTunes, Amazon Prime and Vimeo. You can also purchase a DVD or Blu-ray. If you live outside the U.S. here’s how you can watch in your country.
3. Hostile Planet (2019)
From Director Guillermo Navarro (Pan’s Labyrinth), Hostile Planet is a six-part nature series that premiered on National Geographic. The series is narrated by Bear Grylls (Running Wild with Bear Grylls).
How to watch:
Catch up on episodes online.
Want to know more?
Check out Outside Magazine’s ‘Hostile Planet’ Takes a Candid Look at Climate Change.
4. Rotten (2018)
Rotten is a six-part documentary series featured on Netflix. The series shines a light on the corruption, waste and danger behind the food we eat. The series was produced by the team behind Anthony Bourdain’s Parts Unknown and The Mind of a Chef.
How to watch:
Stream the documentary series on Netflix.
Want to know more?
Here’s a 2018 article from SIERRA Magazine that breaks down Rotten by episode: Netflix’s ‘Rotten’ Reveals the Perils of Global Food Production.
5. Wasted! The Story of Food Waste (2017)
How to watch:
Check out WASTED! on Amazon Prime, iTunes or through a Starz subscription.
Irma is the managing editor at EcoWatch. She graduated from Ohio University’s E.W. Scripps School of Journalism in Athens, Ohio.
- Netflix's 'Rotten' Reveals the Perils of Global Food Production ...
- Sir David Attenborough Set to Present BBC Documentary on ...
- 7 of the Best Ted Talks About Climate Change - EcoWatch
- 9 Environmental Docs to Watch During the Coronavirus Lockdown - EcoWatch