
 568k
568k  233k
233k  41k
41k  Subscribe
By Katherine Wei
We all love to eat. And increasingly, our cultural conversation centers around food—the cultivation of refined taste buds, the methods of concocting the most delectable blends of flavors, the ways in which it can influence our health and longevity, and the countless TV shows and books that are borne of people’s foodie fascinations. However, there’s one aspect we as consumers pay perhaps too little heed: the production of food before it reaches markets and grocery store shelves. We don’t directly experience this aspect of food, and as a result, it’s shrouded in mystery, and often, confusion.
Netflix’s recent documentary series, Rotten, tells the true and sometimes gruesome story of what goes on behind the scenes of global food production—and the pitfalls that accompany the widespread lack of awareness of how and where commonly consumed foods are sourced. The docuseries is produced by Zero Point Zero, the production company behind Anthony Bourdain’s No Reservations and Parts Unknown, and consists of six hour-long episodes, each of which centers around a specific type of food. They feature those at the frontlines of food production (beekeepers, garlic sources, peanut farmers, etc.); those laboring to reduce the dangers of food-induced allergies (restaurant owners and hospital researchers); as well as lawyers, detectives and prosecutors, who explain exactly how food production gets entangled with the law.
It is difficult to pin down a moral to the frankly appetite-suppressing series. While we recommend watching the show, know that it might trigger some panic around food consumption—episodes trigger dark queries (Should we stop dining out altogether considering restaurants lie about catering to food allergies? Are bottles of fake honey mixed in with the real ones at my grocery store? Am I aiding and abetting forced labor in Chinese prisons when I add garlic to my pasta sauce?). However, the experts and producers featured in this true crime-esque series leave many of the common and pressing questions unanswered. So, Sierra turned to food production experts. Read on to learn more about the issues presented in Rotten, and to glean some easy ways to stay informed, and combat potential food production pitfalls.
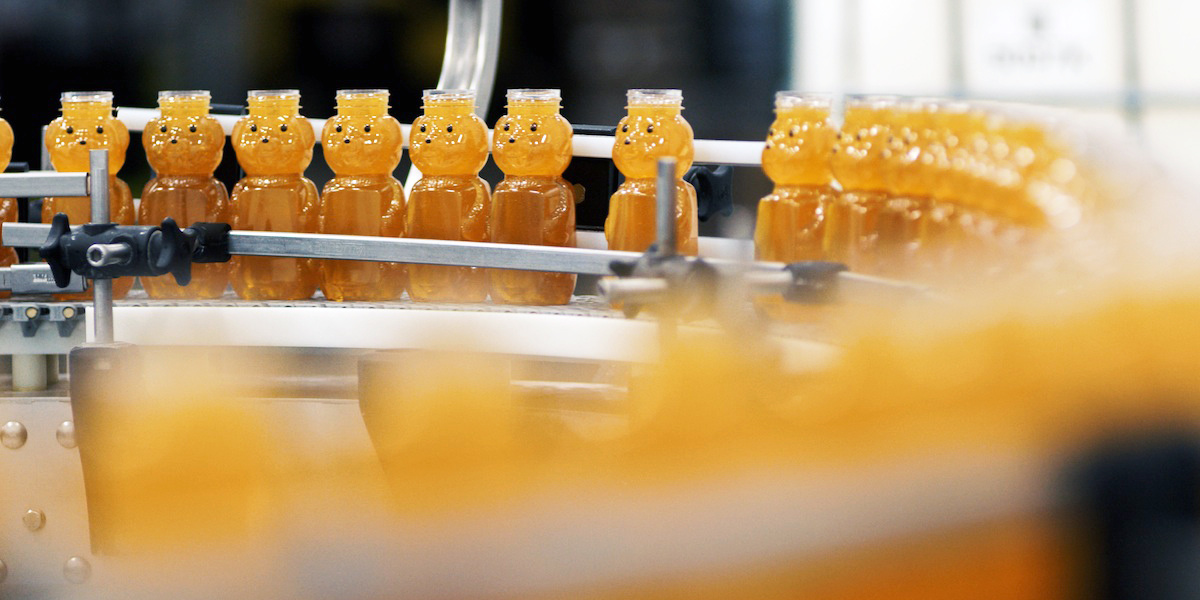
Rotten‘s first episode, Lawyers, Guns and Honey, digs deep into problems beyond the well-documented disappearance of bees and bee colonies. The crew visits honey importers throughout the United States, and a German lab, to discuss the history of cheap honey that’s been diluted with sugar or artificial sweeteners before being shipped to the U.S. The crew talks to prosecutors who busted one nefarious German honey importer, and to importers about how they test samples for “honey adulteration.”
The first solution for protecting oneself from such adulteration is a no-brainer: get in touch with your favorite honey production company and ask where their honey is imported from. Know that labels that claim origin in Asian countries like Thailand, Cambodia, Vietnam, Taiwan, Singapore and Indonesia are likely to be fake. These countries often act as middlemen to China, which “launders” its fake honey in nearby countries before shipping it on to the United States.
Too many brands to grill? Never fear, check out the National Honey Board, which educates consumers, chefs, honey retailers and honey farmers about the production of quality honey. NHB also has a locating service for local honey farms throughout the U.S., making it easy for consumers to find a farm that sells honey produced by its own bee colonies. Another quick tip? Look for a True Honey Source label on the jar you’re about to buy. THS allows consumers to track their honey all the way back through the supply chain to its country of origin, and the beekeeper that harvested it.
Zero Point Zero
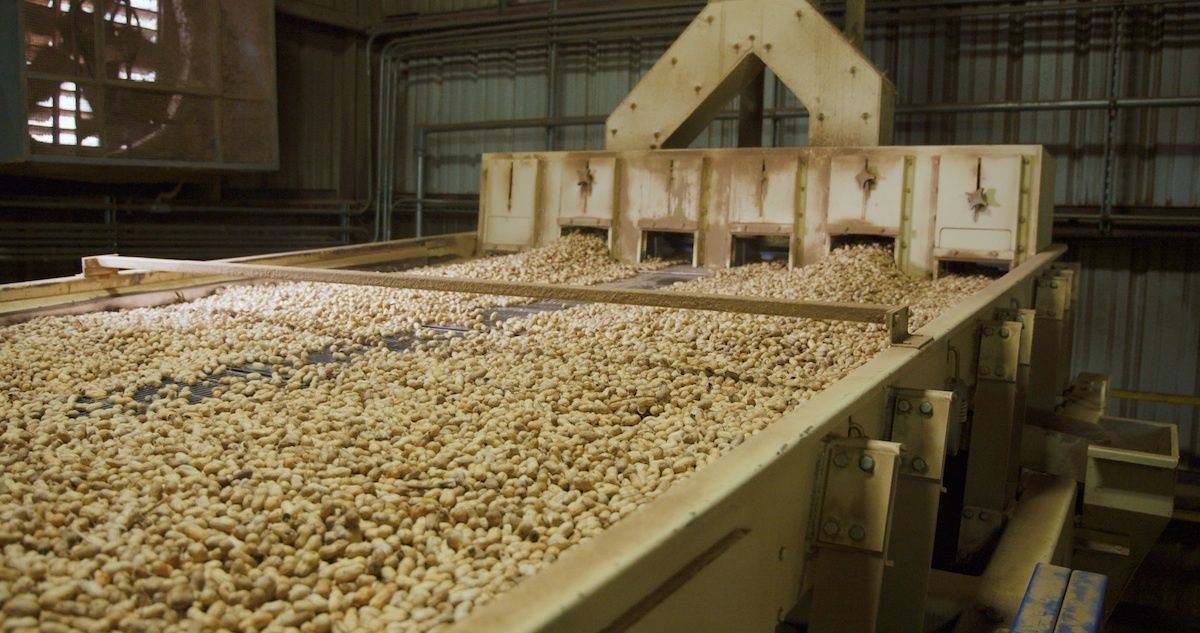
Episode Two, The Peanut Problem, discusses the precipitous rise in food allergy cases in the United States. According to Centers of Disease Control and Prevention, food allergy prevalence among children increased 50 percent from 1997 to 2011, and the American College of Allergy, Asthma and Immunology last October announced a 21 percent increase in peanut allergies in children since 2010. This episode is not about food production scandals so much as the plight that befalls America’s peanut farmers as peanut sales drop. It also chronicles the perils that ensue when a restaurant ignores the needs of customers with peanut allergies (people have died from such negligence).
The Peanut Problem explains that while scientists have been unable to determine the cause of the skyrocketing numbers, restaurateurs are necessarily stepping up their game to allergen-proof their dishes, and schools and communities are educating one another on the complex and sometimes lethal nature of food allergies. The best resources to educate yourself on food allergies, locate your local immunologists and connect with fellow advocates for food allergy awareness? Food Allergy Research and Education and the American College of Allergy, Asthma and Immunology. These organizations also provide grants that fund allergy research projects. Seeking truly allergy-friendly restaurants in the U.S.? AllergyEats is essentially the Yelp of the food allergy community. Users can tweak the search filters according to specific allergies.
Zero Point Zero
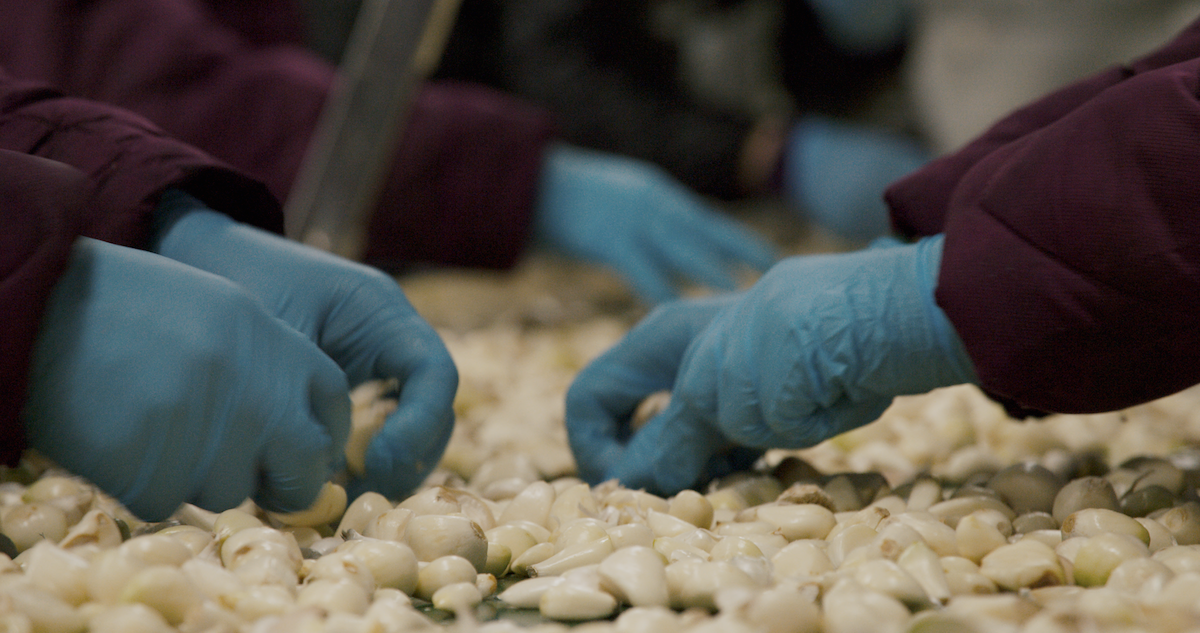
Humans consume almost 50 billion pounds of garlic every year, and the global garlic industry rakes in $40 billion in annual revenue. Garlic Breath tells the story of how the world’s garlic industry is monopolized by a small number of powerful companies—and serves as an especially prescient wake-up call for shoppers unaware of where their food comes from.
Most of the garlic we buy is from China, where many prisoners are forced to peel garlic behind bars, working up to 16 hours a day—often until their fingernails fall off. Also unsettling? The show reveals that many leading garlic companies have found out a way to game the system under the protection of the Fresh Garlic Producers’ Association.
So what’s a garlic lover to do? Start peeling your own cloves. Around 60 percent of the garlic Americans consume from China is pre-peeled, likely thanks to illegal forced labor, so it’s best to buy unpeeled cloves directly from small garlic farms or farmers’ markets. The U.S. Department of Labor maintains an up-to-date list of “goods believed to produced by child labor or forced labor and their source countries.” It’s a good place to start, but if you’re concerned that the DOL’s list may not always be current, you can always check this website to determine the whereabouts of your local farmer’s market.
Zero Point Zero
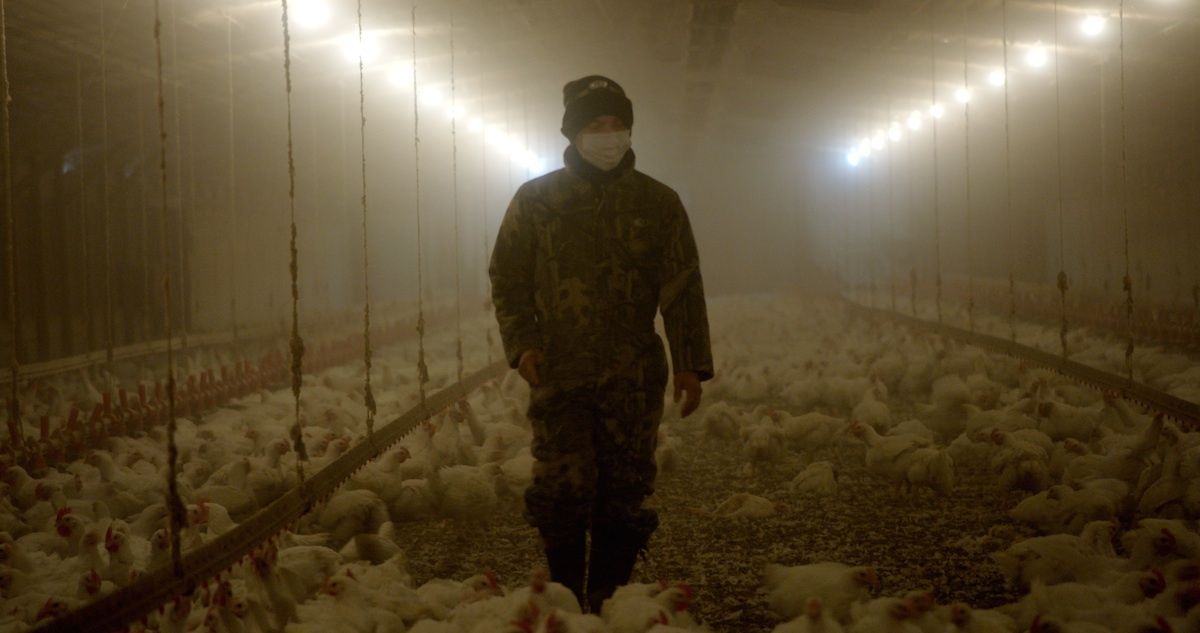
Episode 4, Big Bird, might give you pause before buying another broiler chicken from your local grocery store chain outlet. The story begins with those behind America’s massive chicken production operation: the chicken “growers,” whose control over their farms has in recent years been largely stripped away thanks to corporate giants like Perdue, Pilgrim’s Pride, Sanderson Farms and Tyson. These corporate poultry companies have growers sign contracts to raise birds supplied by “Big Chicken.” While the companies provide feed and medication, the growers build their own farms and otherwise finance the whole operation.
The chickens are contractually raised in ways these corporations deem efficient (but not necessarily humane), and the process is also fashioned into a tournament system that pits growers against one another for bonuses awarded to those who manage to raise the heaviest birds using the least feed. Chickens never see the light of day (this keeps them inactive and plump), and growers at the bottom of the competitive pack wind up losing money as a form of punishment. This is a system curved to solely benefit the corporations.
In 2012, chicken surpassed beef as the most consumed meat in the United States, due to its cheaper price point and mass production efficiency. Not only has chicken production moved beyond traditional poultry farms, but it’s now in the reins of a few major corporations in Brazil, the U.S., Thailand and China—some of which have been bribing their local governments to look the other way as they expand their less-than-humane operations to multiply bird reproduction, and then slaughter them, assembly-line style. The result of such mass production? Broiler chickens come cheap at supermarkets—around $7 each.
Some farmers have ducked out of this system to raise chickens on their own terms, in hopes of keeping the corporate giants from dominating the global chicken market. But one should be prepared to spend much more on ethically raised chicken. Chickens from one farm featured on Rotten (where they’re shown enjoying free space to roam freely) are sold for three times the aforementioned supermarket price. Concerned consumers might start by learning more about the industry lingo decorating meat and egg labels in the grocery store, and learning to tell the marketing terms (neither “natural” nor “cage-free,” for instance, means chickens had humane living conditions) apart from standardized, informational labels (Certified Humane, Animal Welfare Approved).
You could also reach out to farms that sell their own poultry through Community Supported Agriculture (CSA) programs. The U.S. Department of Agriculture provides a local foods directory through which consumers can seek out farms that offer “regular deliveries of locally-grown farm products.” LocalHarvest and EatWild are other websites that provide growing databases for local farms in every state, and even other countries.
In Milk Money, dairy farmers inform viewers that small American family-owned dairy farms might disappear from the market in just 10 years. In the last 40 years, Americans’ milk consumption has decreased by about 33 percent. Since 2000, around 30,000 dairy farms in the U.S. have sold their cows and closed down. Rotten explains that the government no longer invests money to keep dairy prices stable, and that U.S. dairy farms have had to adapt to fluctuating global milk prices and exporting standards ever since the World Trade Organization opened American dairy markets up to the world. As a result, today’s milk prices are set by a government-created formula that fluctuates along with commodity markets, and is impossible for farmers to predict.
Farmers are trying to remedy their losses by focusing on products that bring higher profits than “table milk,” aka pasteurized milk. Organic milk from cows that are raised according to USDA Organic standards and graze freely rakes in twice the revenue of table milk, but it’s a pricey transition for small traditional farmers. Instead, some are turning to raw, unpasteurized milk, a controversial product sold at nearly three times the price of regular milk.
Milk Money covers the heated debate between supporters and naysayers of raw milk. Studies have shown that raw milk reduces chances of asthma, eczema, allergies and nasal infections in children, but many public health officials consider milk straight from the cow a vector for disease. This episode examines the notorious history of raw milk consumption, which can lead to illness and death, and introduces those advocating for farmers to stop selling unpasteurized milk for the profit.
While there is no conclusive crime-solving in Milk Money, it highlights one common consumer mistake: the belief that one should “try everything once” in a quest to cure children’s health problems. The best course of action? Seeking doctors and immunologists who are familiar with their health conditions and can give well-reasoned advice regarding raw milk remedies. Concerned milk drinkers should also get in the habit of checking dairy products’ labels; if the word “pasteurized” is missing, it’s possible that raw milk is an ingredient. And while it’s generally safe to buy from local sources, you might want to confirm with your farmers’ market milk sellers that their products are pasteurized. They should have proof of this. Here‘s a list of states that ban the sale and consumption of raw milk.
America’s fish consumption has doubled in the past five decades. While fishermen have long extolled the ocean as the perfect food source (it grows your food, and the supply seems endless) the series’ finale, Cod Is Dead, exposes a phenomenon with which Rotten viewers have become familiar: the crash of a food production industry caused by dwindling supplies, or corrupted exploitation. In short, domestic fisheries are suffering because the ocean’s fish population has been dropping over the past few decades. We’re specifically talking about “groundfish”—including cod, halibut and flounder—which dwell near the ocean’s bottom, and which have long been popular catches with domestic fisheries on the East Coast.
This episode also moves beyond the dangers of overfishing by exposing fishing tycoon Carlos Rafael, who is infamous for selling fish under the table to dealers, falsifying fish quota, consolidating fishing permits, and exploiting the catch share system. Designed by the Environmental Defense Fund, the catch share system exists to ensure that fishermen get a fixed percentage of the fish they catch (to reduce overfishing). Because the system is not monitored, Rafael has been able to get more than his share of fish and profits. With Rafael currently sentenced to 46 months in jail, however, the imbalance within New England’s fishing scene might bounce back to normal. But what should continue to concern consumers is the question of whether or not we are eating more fish than we can afford to.
Scientists have been saying the ocean supply will crash, while fishermen are arguing that they cannot afford to fish less. So, the government has stepped in to regulate seafood prices, and has begun importing more fish to keep pace with the rise in the country’s seafood consumption. As of now, 94 percent of Americans eat fish from foreign countries. These are shipments that have been frozen, thawed for cheap processing, and frozen again for shipping. Many such products do not come with labels detailing the travels seafood has made before landing in your grocery basket. If this is of concern, try to shop at stores that clearly label their seafood, indicating origins and where the fish was processed, or buy your fish directly from fish markets that source seafood from the nearest fisheries. Seafood processors and government regulators commonly use QR codes and barcodes to trace seafood. Look for such stickers on your supermarket salmon fillets—they’ll help you figure out whether your grocery store keeps track of where its seafood is sourced.
As Rotten repeatedly shows, food is intimately tied to trade, politics, power—susceptible to both market forces and criminal subterfuge. And the global corporate food industry relies, at least in part, on consumers’ ignorance. The overarching moral of the series? Check your food labels carefully, and whenever possible, buy locally.
Reposted with permission from our media associate SIERRA Magazine.