
 568k
568k  233k
233k  41k
41k  Subscribe
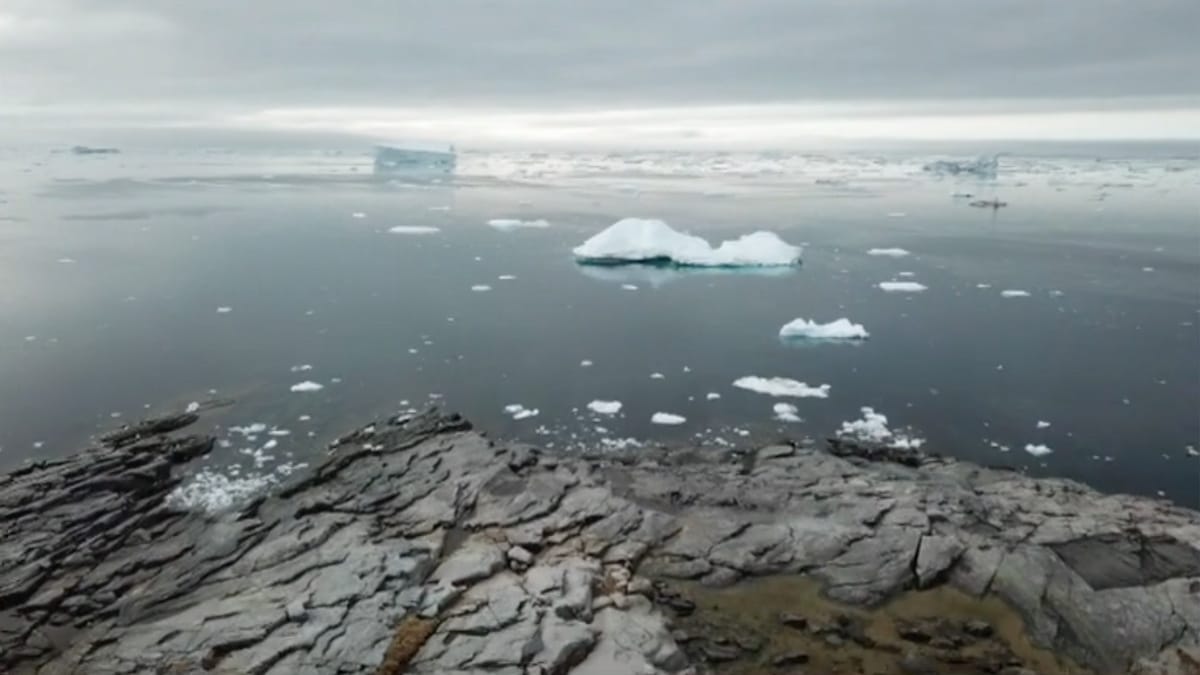
For the first time on record, the main nursery of Arctic sea ice in Siberia has yet to start freezing by late October. Euronews / YouTube
By Sharon Guynup
At this time of year, in Russia’s far north Laptev Sea, the sun hovers near the horizon during the day, generating little warmth, as the region heads towards months of polar night. By late September or early October, the sea’s shallow waters should be a vast, frozen expanse.
But not this year. For the first time since records have been kept, open water still laps this coastline in late October though snow is already falling there.
“In one sense, it’s shocking, but on the other hand, it’s not surprising,” said Walt Meier, a research scientist at the University of Colorado Boulder’s National Snow and Ice Data Center (NSIDC). Over the past 40 years, unprecedented climate change-driven events such as this have become the new normal in the Arctic — which is heating up far faster than the rest of the planet.
While weather patterns at the top of the world vary, the overall changes are dramatic and occurring so rapidly that the region may be entering a “new Arctic” climate regime, says Laura Landrum, an oceanographer with Colorado’s National Center for Atmospheric Research (NCAR). The Arctic is transitioning from a mostly frozen state into an entirely new climate — and impacting the entire planet, she said.
Meier calls the Arctic the “bellweather of climate change” because it’s a place where a small bump in temperature has real impact: a change from -.5°C to .5°C (31°F to 33°F) is the difference between ice skating and swimming, he said, while a couple of degrees warmer in Florida may not even be noticed.
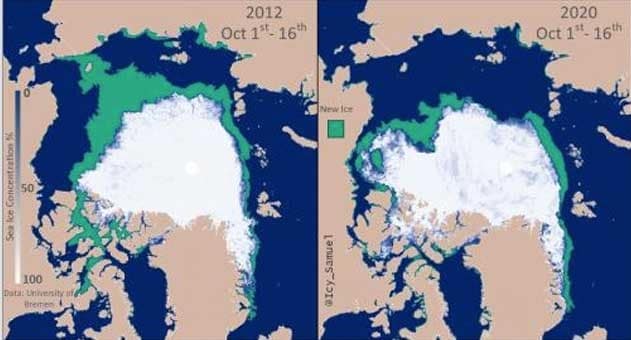
Comparison of autumn sea ice formation for the first half of October 2012 (the record year for Arctic sea ice extent loss) and in 2020 (second place for sea ice extent loss). The satellite record goes back to 1979. @Icy_Samuel, data provided by NSIDC
An Extreme Year in a Region Known for Extremes
It’s been quite a year in Siberia — on land, and off the Arctic coast. The first six months were extraordinarily warm and the sea ice began melting early. By May, fires burned in permafrost zones that are usually frozen year-round. In June, temperatures hit a record-breaking 38°C (100°F), and by September, blazes incinerated about 14 million hectares (54,000 square miles) of tundra — an area the size of Greece.
A combination of changing climate and quirky weather are now preventing this fall’s freeze-up. Siberian sea temperatures are higher than usual because of this year’s extreme climate events. The heat wave warmed the many rivers that feed into the Arctic Ocean and also triggered an early melt-out. Without ice and snow that acts like a mirror — reflecting the sun’s heat back into the atmosphere — the dark ocean absorbed extra warmth over the summer. Much of the remaining ice disintegrated. Then in September, unusually strong, warm winds blew in from the south, pushing any newly formed ice out to sea.
In the past, a shift in the winds wouldn’t have mattered much. Back in the 1980s, Igor Polyakov, a climate scientist at the University of Alaska, remembers being part of expeditions that landed small seaplanes on sea ice to study the Siberian Arctic. He described the Laptev Sea as a solid, glaring white landscape punctuated by pastel-tinged ice: rose-colored, light blue and green. Since the regions’ deeply cut gulfs and bays are located in shallow continental shelf waters, they mostly stayed frozen.
But by summer 2002, sea ice was less stable, and today, ice breakers can travel the region through open water. “The changes are dramatic,” he said. “It happened in front of our eyes. Now, in the summer, there’s no ice at all for thousands of kilometers, sometimes as far north as the 85th parallel.” That’s five degrees from the North Pole.
In the 1980s, about 80% of the Arctic Ocean and its surrounding seas were frozen in thick, “old ice” that mostly survived the summer melt, said James Overland, an oceanographer with the U.S. National Oceanic and Atmospheric Administration (NOAA) who has studied the Arctic for decades. “Now much of that has to refreeze each winter. We did not expect to see this so soon.”

Arctic sea ice extent on Oct. 25, 2020 was at a record low 5.613 million square kilometers for this date, surpassing the record set in 2019 of 6.174 million square kilometers. ChArctic NSIDC
A Dangerous Cycle
Across the Arctic, ice is now thawing earlier, freezing later, thinning and — in many places — disappearing altogether.
Thinner ice is less resilient. Picture ice cubes in a glass. Thick chunks last longer and melt slower than ice chips and slivers. All disintegrate faster in warmer liquid. This is a huge problem in the Arctic, where vast stretches of open blue water absorb the sun’s heat during summer, when the sun never really sets. Those warm waters flow beneath the ice to melt it from below.
This year, the overall health of the sea ice was bleak: the end-of-summer minimum was tracking at the second-lowest amount of sea ice in 42 years, Landrum said. Measurements by NASA and the NSIDC found it was about 2.6 million square kilometers (1 million square miles) lower than the average from 1981 to 2000. NASA satellite data shows an overall downward trend in Arctic ice is averaging 12.9% a year.
This year’s average global temperature will be among the warmest on record, researchers say. Current models predict the Arctic will be ice-free in summertime by 2040 – 2050. Overland thinks this so-called Blue Ocean Event (BOE) might come even sooner.
Many factors are colliding that could speed massive melt. New feedback loops continue to emerge, compounding and accelerating changes. For example, early climate models didn’t factor in methane — a potent greenhouse gas — that’s pouring into the atmosphere from melting permafrost. The tundra is now thought to be emitting 300-600 million tons of carbon yearly, the equivalent of driving between 65 and 129 million cars for a year.
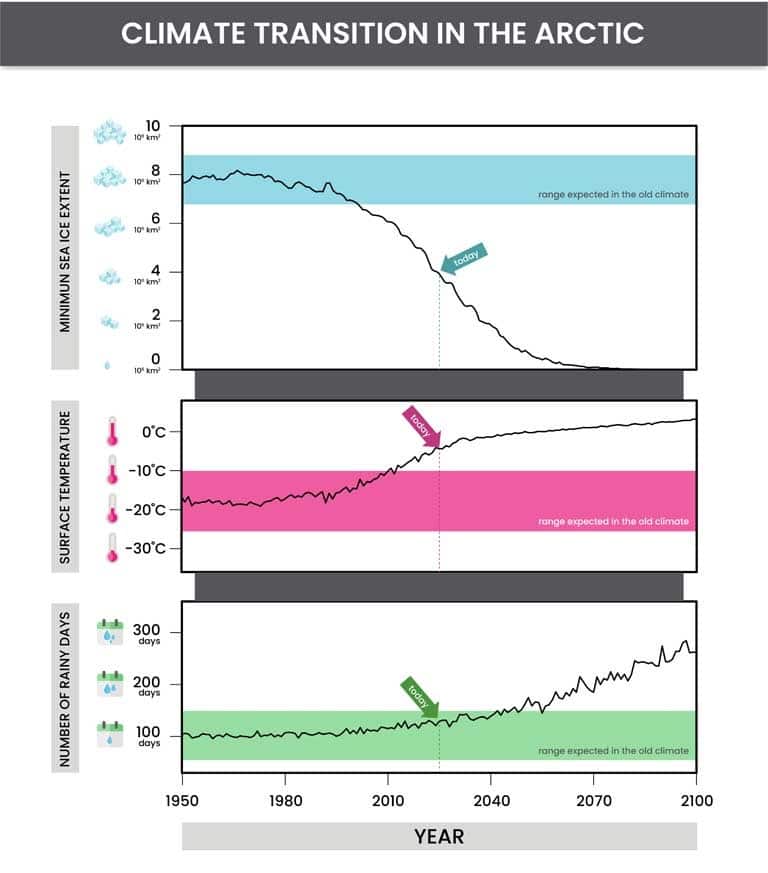
The Arctic appears to be changing into an entirely new climate state due to rapid warming. The extent of sea ice in the late summer, when it reaches its minimum each year, has already entered a statistically different climate, with surface air temperatures and the number of days with rain instead of snow also beginning to transition. Simmi Sinha, ©UCAR
Likewise, thick ice that withstood high winds and storms decades ago, now is thin and can be severely damaged by such storms — amplifying one-off extreme weather events. Then there’s “Atlantification,” the increasing intrusion of salty, temperate Atlantic Ocean waters into chillier Arctic seas.
The changes in the Laptev Sea, long known as an Arctic “ice factory,” add another concerning factor. In the past, sea ice created there typically moved with wind and ocean currents, traveling over the North Pole towards Greenland. Depending on changing conditions, that ice then spent years trapped in a slowly spinning gyre in the Beaufort Sea; ended up off the Greenland coast; or piled up on the north shore of the Canadian Archipelago, building ice ridges that towered 3 to 9 meters (12 to 30 feet) high — multi-year ice that resisted melting.
That system no longer works as before, with the Laptev Sea now turning to blue water every summer, the “ice factory” largely shut down, and multi-year Arctic sea ice at a record low — and still dropping.
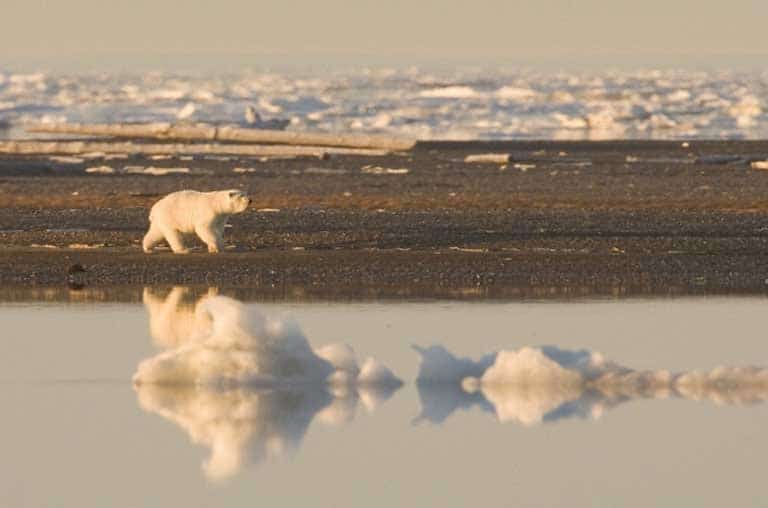
A polar bear prowls the Arctic shoreline. VisualHunt.com
An Interconnected Planet
The polar bear has become the poster child for climate change impacts on wildlife. But Ursus maritimus isn’t the only victim; cascading affects throughout the Arctic food chain are impacting everything from plankton to seals, globally important fisheries species like pollock, on up to whales, musk ox and other cold climate mammals.
In Siberia, reindeer are starving in wintertime. “Weather whiplash” is bringing rain, in what should be the frigid dead of polar night. The falling rain freezes atop the snowpack, forming a layer of thick ice that makes it impossible for reindeer to dig down to grass and plants below; many now die of hunger. These once-rare Arctic warm spells are now commonplace.
Indigenous people are also suffering. Without proper ice platforms, it’s growing harder for them to hunt for the walrus and whales that sustain them. Coastlines are eroding as sediments held together by permafrost become unglued. And rising seas are inundating coastal villages.
Worse, rapidly escalating climate change in the Far North is being exported to the rest of the world: The Earth’s biomes are interconnected. “You can’t alter one system without affecting others,” explained Mark Serreze, a research scientist for the NSIDC. “What happens in the Arctic doesn’t stay in the Arctic, and the changes are unfolding faster than our ability to keep up with them.” Serreze, in his 2018 book framing the problem, dubbed the north polar region as, “The Brave New Arctic.”
Serreze notes that the Arctic covers a massive area; it’s the size of the lower 48 U.S. states combined. Amplified Arctic warming alters global weather, and impacts the rest of the planet, changing weather, ocean patterns and the jet stream.
Intense storms, droughts and heat waves — once every 100- or 500-year extreme weather events — are now occurring regularly around the globe, with devastating impacts on people, economies, and ecosystems. This year alone, for example, saw massive record wildfires in California, Colorado, Siberia, and Brazil, and no one yet knows how this autumn’s delayed Arctic re-freeze might impact the planet’s upcoming weather.
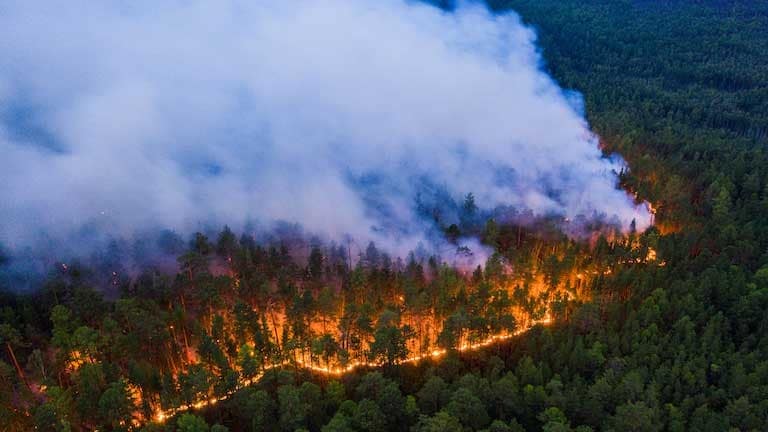
A fire burning through northern forest in Krasnoyarsk, Siberia, in July 2020. Greenpeace International
Julienne Stroeve, who specializes in sea ice research at NSIDC, adds another potential serious impact to the list: threats to our food supply. “What’s predicted to happen in agricultural sectors is not good news … We’re going to be living on a very different planet if we keep adding greenhouse gases to the atmosphere,” she said. “We’re conducting this blind experiment, and we don’t yet know the real implications.
Stroeve is desperate to inform people of the urgency: “How do you sell climate change to be as much of an emergency as COVID-19? Except that it will kill a lot more people.”
She believes we can rally. If we can produce a COVID-19 vaccine in record time, and heal the ozone layer through the Montreal Protocol, Stroeve thinks “we have the ability to change the course of this train.”
Reposted with permission from Mongabay.
- Atmospheric Carbon Dioxide Levels Are at Their Highest in 23 ...
- Russia Unveils Plan to 'Use the Advantages' of Climate Change ...
- Arctic Sea Ice Melting by 2035 Is Possible, Study Finds
- Harp Seal Pups in Trouble in Quebec Due to Low Sea Ice
- A Massive Methane Reservoir Is Lurking Beneath the Sea
- Vicious Climate Cycle in Russia Is Melting Permafrost, Releasing Methane and Fueling Wildfires - EcoWatch