
 568k
568k  233k
233k  41k
41k  Subscribe
Bayer to Pull Glyphosate Products, Including Roundup, From U.S. Home and Garden Market
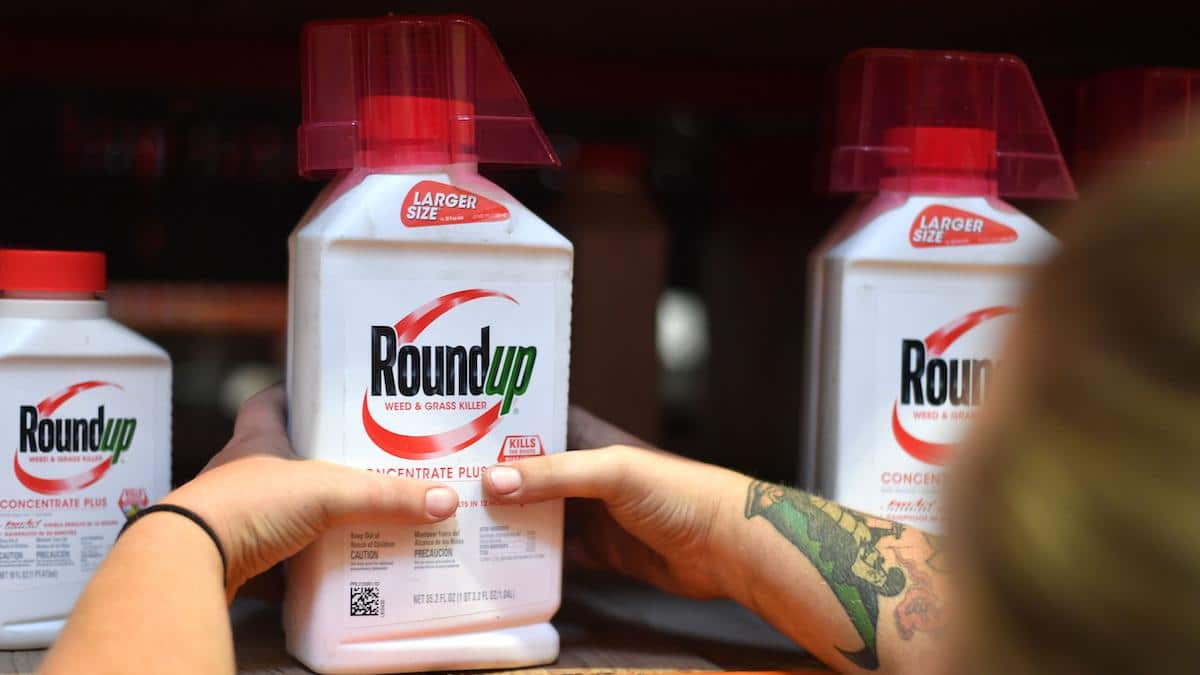
Roundup products on a shelf at a store in San Rafael, California, on July, 9, 2018. JOSH EDELSON / AFP via Getty Images
Bayer will no longer sell glyphosate-containing products to U.S. home gardeners, the company announced on Thursday.
The move comes as the company currently faces around 30,000 legal claims from customers who believe use of these products — including the flagship Roundup — caused them to develop cancer, as AgWeb reported.
“Bayer’s decision to end U.S. residential sale of Roundup is a historic victory for public health and the environment,” Center for Food Safety executive director Andrew Kimbrell said in a statement. “As agricultural, large-scale use of this toxic pesticide continues, our farmworkers remain at risk. It’s time for EPA to act and ban glyphosate for all uses.”
The antithesis of eco-friendly lawn care, Glyphosate is a controversial ingredient because it has been linked to the development of non-Hodgkin lymphoma, as Cure noted. The World Health Organization’s International Agency for Research on Cancer declared that it was “probably carcinogenic to humans,” in 2015. While the U.S. Environmental Protection Agency (EPA) under former President Donald Trump ruled that the chemical did not pose any risk to human health, the Biden Administration later admitted that the review was flawed and needed to be redone, as Common Dreams reported. Still, it refused to take it off the market in the meantime.
Bayer’s decision comes in response to the many lawsuits related to glyphosate that it inherited when it acquired Monsanto in 2018. Juries sided with the plaintiffs in three highly-watched trials before Bayer settled around 95,000 cases in 2020 to the tune of $10 billion. That settlement, which was one of the largest in U.S. history, allowed Bayer to continue to sell Roundup without any warnings. However, the company still faces further litigation, and said it decided to pull the product from residential use in order to prevent more. More than 90 percent of recent claims come from the residential home and garden market, AgWeb reported.
“This move is being made exclusively to manage litigation risk and not because of any safety concerns,” the company said when it announced its decision.
The products will be replaced with different active ingredients beginning in 2023, following reviews by the EPA and state regulatory bodies. January 2023 was the earliest the change could reasonably be implemented, Bayer Crop Science Division president Liam Condon told AgWeb.
“This is from a regulatory and logistical point of view (of what’s) possible,” Condon said during a conference call with investors, as AgWeb reported.
For an expert review of companies that use environmentally friendly lawn care practices, be sure to check out our lawn care companies guide.
- As Bayer Considers Ending Some US Glyphosate Sales ...
- Undisclosed Ingredients in Roundup Are Lethal to Bumblebees ...