
 568k
568k  233k
233k  41k
41k  Subscribe
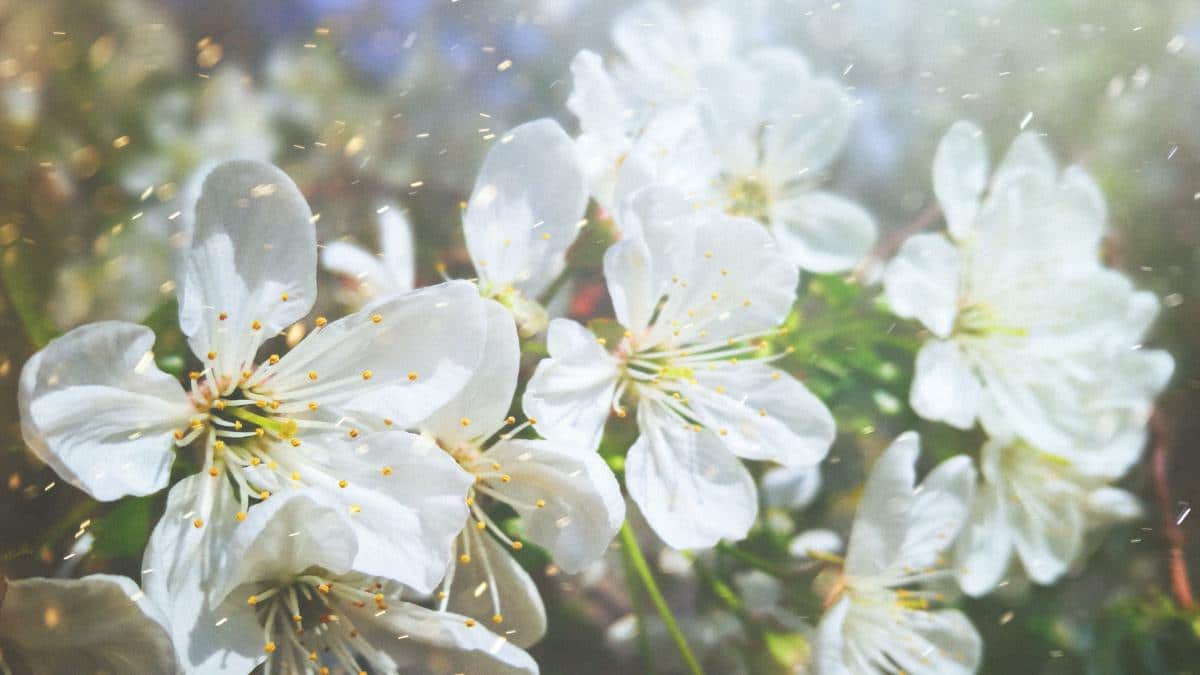
New research finds North America's pollen season is starting earlier and lasting longer than it did four decades ago. Peter Zelei Images / Getty Images
By Ayesha Tandon
The research, published in the journal Proceedings of the National Academy of Sciences (PNAS), concludes that the North American pollen season is now starting 20 days earlier and lasting eight days longer than in 1990. Climate change is responsible for roughly half of these changes, the study says.
The study also finds that climate change is a “significant contributor” to a 21% increase in pollen levels since 1990. The authors note that the increase in tree pollen levels is bigger than the increase in either grass or weed pollen.
“Climate change is already worsening pollen seasons,” the lead author of the study tells Carbon Brief, adding that this is “bad news for people with respiratory health problems.”
‘Worsening’ Pollen Seasons
Pollen is a powdery substance that is released into the air by plants, such as grasses, weeds, and trees. Pollen grains float through the air – if they land on another plant of the same species, they can fertilize it to produce seeds for a new plant.
Plants only release pollen into the air throughout the warm “pollen season”. For the US, this begins – depending on the state – around February and continues throughout the summer.
Research shows that warmer temperatures and higher CO2 levels can shift pollen seasons and increase pollen levels. However, this study is the first to calculate the contribution of climate change to historical pollen data trends, lead author Dr William Anderegg from the University of Utah tells Carbon Brief:
“The central new aspect of this study is a detection of a ‘fingerprint’ of climate change on pollen trends in the US and Canada and in attributing how much of these trends is likely due to climate change.”
To determine the impact of climate change on the pollen season, the team analyzed pollen records from 60 cities in the US and Canada from 1990–2018. The data are shown below.
The map on the left shows changes in pollen level – in other words, how much pollen the air is carrying. Red circles indicate rising pollen levels over time and blue circles indicate falling levels. Circle size corresponds to how many years of data were available – larger circles mean more years of data are used.
Similarly, the figure on the right shows changes in the start date of the pollen season. Red circles indicate an earlier start date and blue circles indicate a later start date.
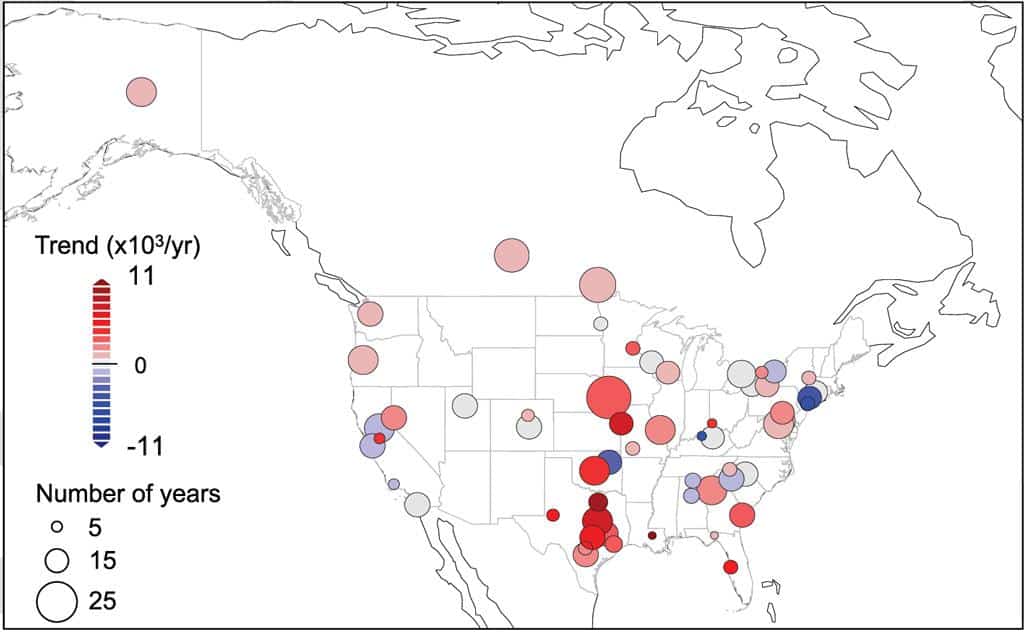
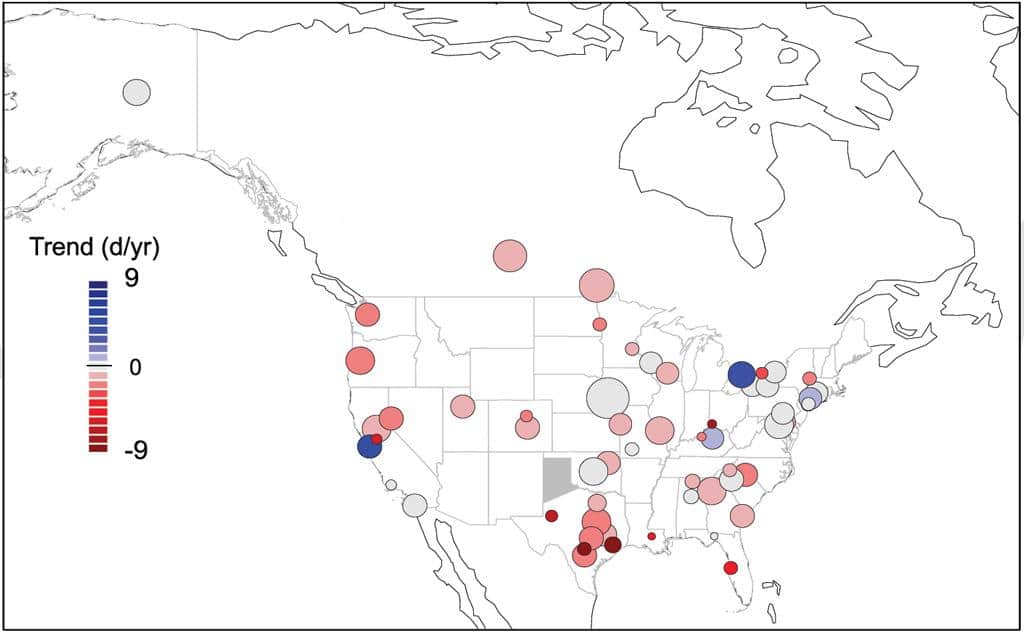
Pollen data from 60 stations in the US and Canada. Changes in “pollen integral” (top) and changes in pollen season start date (bottom). Red circles indicate higher pollen levels and earlier start dates, respectively. Circle size is proportional to the number of years of data at each station. Source: Anderegg et al. (2021).
The study also shows that the North America pollen season has become around eight days longer and has also shifted to start around 20 days earlier. This suggests a “seasonal shift of pollen loads to earlier in the year,” according to the paper.
The authors find that between 1990-2018 the average annual pollen level increased by 21%. The map shows that the largest, most consistent increases were seen in Texas and the midwestern US.
Allergic Reaction
There are three main types of pollen that can cause allergic reactions in humans, such as hayfever – “tree pollen,” “grass pollen” and “weed pollen”. Many people are more allergic to some types than others.
The impacts of climate change are different for different plants, so the authors analyzed pollen trends for each of these three plant types individually. They found that, of the three main plant types, the biggest increase in pollen level is from tree pollen.
The longer pollen season and the higher levels of pollen in the air means that peoples’ exposure to allergenic pollen has “increased significantly” over recent decades, the paper notes. Anderegg adds that this is “bad news” for those with respiratory health problems and that it is “likely to get worse in coming decades.”
Dr Claudia Traidl-Hoffman from the Technical University of Munich, who was not involved in the study, tells Carbon Brief that “allergies are the most common chronic inflammatory diseases and will be further fueled by climate change.”
Climate Changes ‘Worsens’ Pollen Seasons
As well as analyzing changes in the pollen season, the authors determined how much climate change contributed to these trends.
To do this, the authors tested a range of annual and seasonal climate variables, including temperature, rainfall, frost days and atmospheric CO2 level. These analyses were run on 22 Earth system models from the fifth and sixth Coupled Model Intercomparison Projects (CMIP).
The study finds that average annual temperature is the strongest predictor of changes to annual pollen level, spring level, pollen season length and pollen season start date.
Anderegg tells Carbon Brief that temperature is a “key determinant” in plant development and that “a longer growing season due to climate change appears to mean a longer pollen season.”
Dr Thanos Damialis from the University Centre for Health Sciences at University Hospital Augsburg, who was not involved in the study, tells Carbon Brief how climate change can affect pollen production:
“Land eutrophication and increased temperatures, along with higher urbanity and anthropogenic emissions – such as nitrogen dioxide – are known to have a multiple effect on plants: they produce more biomass, more flowers, the plant produces more pollen, which all result in more airborne pollen in urban environments.”
The figure below shows the contribution of climate change to annual pollen level (dark red), spring pollen level (light red), pollen season start date (dark green) and pollen season length (light green). For each of these factors, two different time periods are shown – 1990-2018 and 2003-2018. The black line shows the model average.
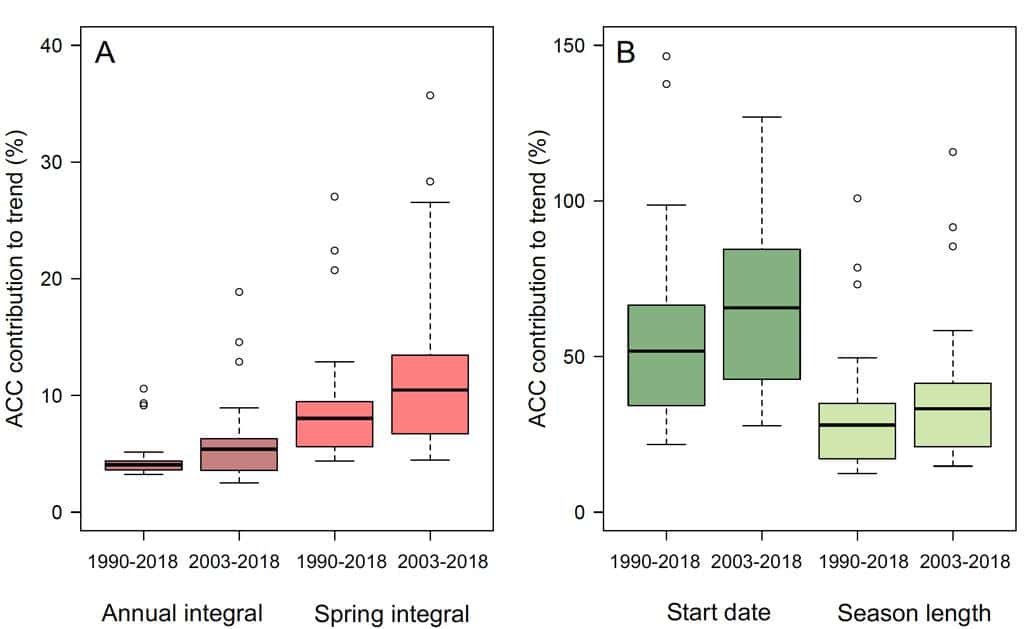
Impact of climate change on annual pollen level (dark red), spring pollen level (light red), pollen season start date (dark green) and pollen season length (light green). Source: Anderegg et al (2021).
The study concludes that climate change is responsible for roughly 50% of the changes to the pollen duration and start time, and 8% of the changes to pollen level.
The authors note that the impact of climate change is more significant in spring than annually due to a “seasonal compensation” effect, whereby a decrease in summer pollen levels could lower the annual average.
The figure above also shows that the influence of climate change on pollen seasons has become larger over time. For example, the study finds that between 1990-2018 climate change was responsible for between 35-66% of the shift in pollen start date. However, between 2003-2018, it contributed to between 45-84% of this shift.
These findings suggest that the impact of climate change on the pollen season is getting stronger over time, the authors say.
The paper notes that the increase in monitoring stations in recent years could also have influenced this result. However, the authors add that the results are robust when “sensitivity analyses” are conducted around the number of stations included and the longevity of station observations.
Traidl-Hoffman says the study is of “utmost importance” for investigating the impacts of climate change on health. She tells Carbon Brief:
“Climate change is impacting enormously on our health and allergic diseases are in the first line of importance.”
Reposted with permission from Carbon Brief.
- 35 Worst Cities (and the Worst State) for Asthma and Allergy ...
- Pollen Is Getting Worse, but You Can Make Things Better With ...
- It's Official: Climate Change Worsens Global Pollen Season ...
- January Warm Spells, March Freezes: How Plants Manage the Shift From Winter to Spring - EcoWatch
- Is Climate Change Making Allergy Season Worse? These Scientists Think So - EcoWatch