
 568k
568k  233k
233k  41k
41k  Subscribe
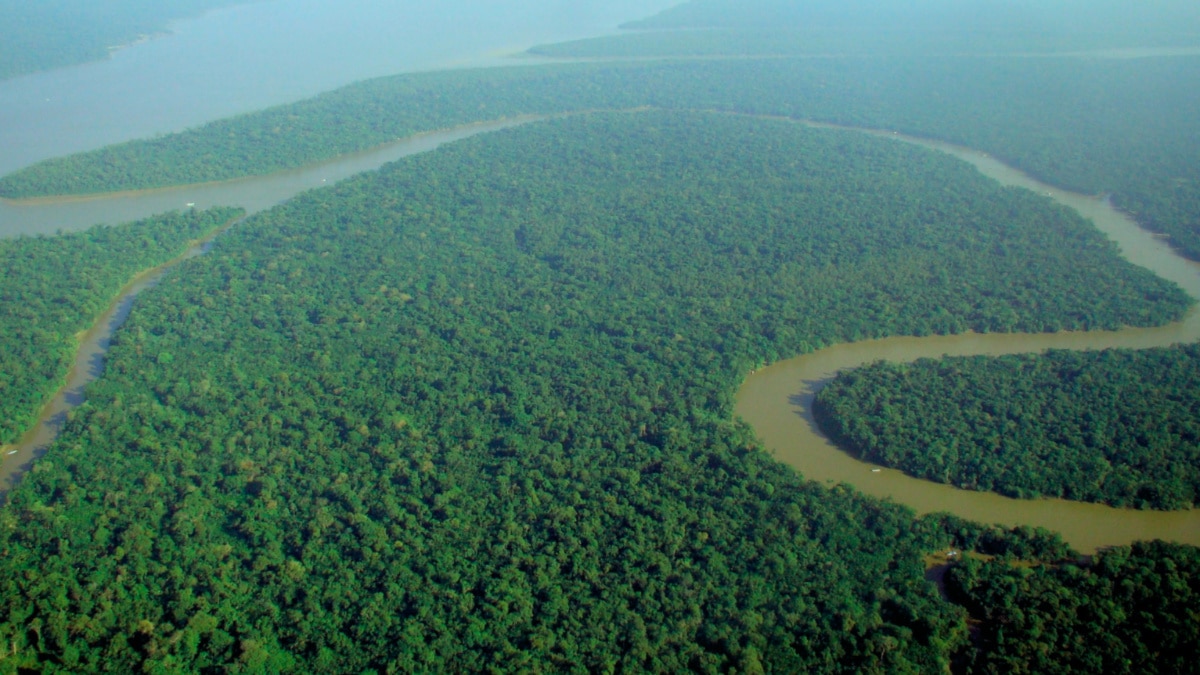
An aerial view captures the Amazon Rainforest in Brazil. ubasi / Wikimedia Commons / CC by 2.0
The Uru-Eu-Wau-Wau are a tribe of less than 300 people in the Brazilian Amazon Rainforest who first came into contact with people outside their community in the early 1980s, according to the Povos Indigenas No Brasil. While they still maintain many of their tribal ways, they and other tribes have recently begun using modern drones to detect and fight illegal deforestation in their territory.
“Nature is everything to us,” Awapy Uru-Eu-Wau-Wau told CNN. “It is our life, our lungs, our hearts. We don’t want to see the jungle chopped down. If you chop it all down, it will definitely be hotter, and there won’t be a river, or hunting, or pure air for us.”
Awapy is a member of the Uru-Eu-Wau-Wau tribe. Last December, he and other young leaders from six Indigenous communities learned how to operate drones to track deforestation, Interesting Engineering reported. The training was held by World Wildlife Federation (WWF) and the Kanindé Ethno-Environmental Defense Association, a local NGO dedicated since 1992 to protecting the Uru-Eu-Wau-Wau and the environment in their home state of Rondônia, Brazil.
“They really accepted the technology with open arms, and really started to use it,” WWF Brazil Senior Conservation Analyst Felipe Spina Avino told CNN.
Avino added that the Indigenous trainees became hooked when they realized they could see the forest from above and keep patrol over much greater areas than ever before.
According to CNN, the Uru-Eu-Wau-Wau tribal lands lie within a roughly 7,000-square-mile protected area of dense jungle that can be difficult to traverse and monitor on foot. Drones allow them to cover more territory faster and avoid potentially dangerous confrontations with loggers, miners and land-grabbers.
Within the first month of drone surveillance, the tribe discovered an area of about 494 acres being illegally deforested within their reserve, Reuters reported. Days later, a helicopter spread grass seed on the plot, indicating that the land would be used for cattle pasture; Awapy’s team caught it all on drone video, reported CNN.
“The technology today, for territorial monitoring, is very worthwhile,” said Bitate, a 19 year old from Awapy’s tribe who was also trained in drone operation, reported Reuters. “Without a drone, that deforestation — which was already advanced — would still be unknown to us.”
They called FUNAI, the Brazilian governmental agency in charge of Indigenous affairs, to stop the illegal land-grab, supplying video evidence and GPS coordinates, but the latter did not respond before the destruction was done, reported Reuters. Awapy hopes technology will help tribes stop deforestation sooner, as it is already too late once trees have been felled and burned, Reuters reported.
So far, the WWF-Kaninde project has donated 19 drones costing around ,000 each to 18 organizations focused on the Amazon, Interesting Engineering reported.
Aerial drones have been used by Indigenous peoples in Ecuador, Peru and other places for about three years after becoming more affordable, reported Reuters. The images illustrate the damage of deforestation.
“Seeing the extent of deforestation from above is much more impactful than standing in the middle of it,” Jessica Webb, senior manager for global engagement with Global Forest Watch told Reuters.
The high-resolution images, video and GPS mapping data from drones can also be submitted in court as evidence of illegal activities, CNN reported. Drones are likely to become more widespread as technology advances allow for longer range and stronger batteries.
“The key is not to think of the technology as a silver bullet,” Webb told CNN, advocating to pair the new technology with Indigenous knowledge to create more powerful protections for the forest.
Keeping remaining rainforest intact is crucial to slow global warming since trees act as a carbon sink. Conservation also protects the Amazon’s rich biodiversity, and is critical to food security, water services and the preservation of Indigenous cultures, noted WWF.
Despite this, Brazilian President Jair Bolsonaro consistently pushes to develop Indigenous lands and allow mining and commercial farming to deforest the Amazon. Last year, the Brazilian Amazon suffered its highest level of deforestation since 2008, with this year poised to become worse, WWF reported.
Awapy and his team have faced death threats from illegal loggers and land-grabbers for their work protecting the forest, CNN reported, but they remain determined to use this new technology to protect their home for future generations.
“My hope is that while I am alive, I want to see the jungle standing, the jungle intact. That is my hope,” Awapy told CNN.
- Stunning Drone Footage Shows Greenland Literally Melting Away ...
- Drone Footage Captures Rare Finless Porpoises in Hong Kong ...
- Amazing Drone Footage Captures Thousands of Turtles Migrating ...
- New EarthX Special 'Protecting the Amazon' Suggests Ways to Save the World’s Greatest Rainforest - EcoWatch
- Humans Sustainably Managed Much of Earth’s Lands for Thousands of Years, Study Affirms
- Scientists Use Drones to Eradicate Invasive Rats From Galapagos