
 568k
568k  233k
233k  41k
41k  Subscribe
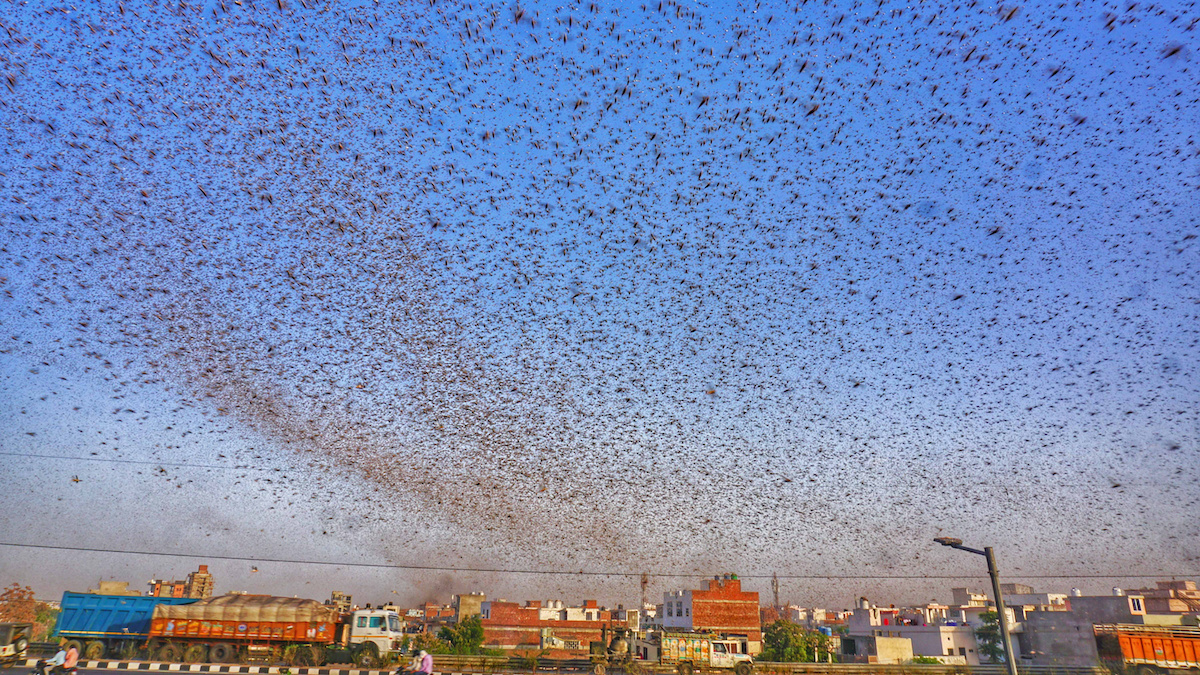
Locusts swarm over Jaipur, India on May 25, 2020. Vishal Bhatnagar / NurPhoto via Getty Images
India is facing its worst desert locust invasion in nearly 30 years, and the climate crisis is partly to blame.
The locusts spawned a swarm of social media posts Monday when they entered the city of Jaipur, as The Indian Express reported, but the crop-devouring insects have been wreaking havoc since May in an invasion that both began earlier and is extending farther than usual. Several farmers told The Wire that they hadn’t seen an invasion this severe in their lifetimes.
“Even my father, who is 86, said he hasn’t ever seen anything like this. Only heard about this in folk tales,” 64-year-old Madhya Pradesh farmer Sooraj Pandey told The Wire.
Locusts are not uncommon in the northwest Indian state of Rajasthan, but this year they have also entered the states of Madhya Pradesh and Uttar Pradesh for the first time since 1993 and the state of Maharashtra for the first time since 1974. They also do not usually move so far into Rajasthan from the border with Pakistan, according to AFP reporting published by Al Jazeera.
So far, the insects have devoured almost 50,000 hectares or 123,500 acres of agricultural land in seven Indian states, The Associated Press reported, putting pressure on farmers already struggling with the impacts of the coronavirus lockdown.
The government has responded with pesticides, drones and sprayers mounted on vehicles, while farmers have resorted to banging plates, whistling and throwing stones to drive the locusts away.
“These insects are giving us sleepless nights. We are more worried about them than the virus,” Mandeep Singh, a cotton farmer from Punjab, told The Associated Press.
A swarm of 40 million locusts can cover the space of a square kilometer (approximately 0.4 square miles) and eat the same as 35,000 people in a day, according to UN Food and Agricultural Organization data reported by The Wire.
Unusually large locust swarms bred on the Arabian Peninsula in early 2019 following heavy rains and cyclones in the region, according to AFP. Those ideal breeding conditions were the product of the climate crisis, as warmer than usual temperatures in the western Indian Ocean fueled the storms.
“These warm waters were caused by the phenomenon called the Indian Ocean Dipole — with warmer than usual waters to its west, and cooler waters to its east. Rising temperatures due to global warming amplified the dipole and made the western Indian Ocean particularly warm,” Indian Institute of Tropical Meteorology climate scientist Roxy Mathew Koll told The Wire.
The locusts have already caused significant damage in East Africa earlier in 2020 before migrating to India through Iran and Pakistan.
India’s locust situation could get even worse, both this year and in the future.
In the short term, more locusts could arrive from Africa in June, according to AFP. There is also a concern that the locusts already in India could breed, The Associated Press pointed out.
“It is an alarming situation,” KL Gurjar, a top official at India’s Locust Warning Organization, told The Associated Press. “But we are more worried of their breeding. If that happens, it could be devastating for our farmlands.”
In the future, climate change could also make locust invasions like this year’s more common.
“Climate change may well play a role here, mainly because, according to forecasts by international climate researchers, precipitation will increase in the southern Arabian Peninsula and northern East Africa,” University of Trier biodiversity scientist Axel Hochkirch told The Wire. “This means that there will be more frequent ‘very humid’ phases, such as we have had since 2018, and it is therefore possible that such swarms will simply occur more frequently.”
- A Second, Larger Wave of Locusts Invades East Africa Amid Pandemic
- 'Murder Hornets' Spotted in U.S. for the First Time - EcoWatch
- Worst Locust Swarm to Hit East Africa in Decades Linked to Climate ...
- Locust Swarms Prompt Somalia to Declare National Emergency ...
- The Climate Emergency Won’t Wait for the Press to Play Catch-Up - EcoWatch
- The Climate Emergency Won’t Wait for the Press to Play Catch-Up - EcoWatch