
 568k
568k  233k
233k  41k
41k  Subscribe
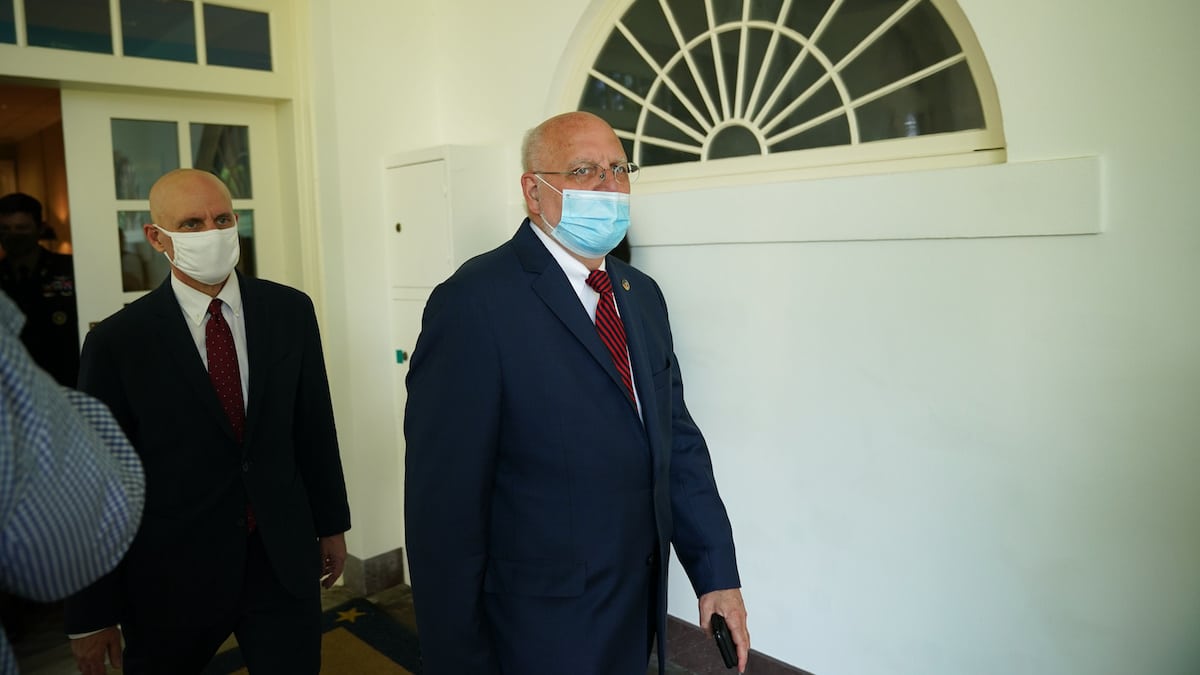
Director of the Centers for Disease Control Robert Redfield arrives for Trump's speech on vaccine development on May 15, 2020 in the Rose Garden of the White House in Washington, DC. MANDEL NGAN / AFP via Getty Images
The appearance that the Centers for Disease Control and Prevention (CDC) is taking orders from political leaders grew stronger this week as the organization told states to prepare facilities for a coronavirus vaccine before November’s general election. The issue raised alarm for health experts who worry that a vaccine will be rolled out before its safety and efficacy are well established, according to The New York Times.
The letter, written by Director of the CDC Dr. Robert Redfield, is dated August 27 — the same day that President Trump gave his speech at the Republican National Convention claiming that a vaccine would be available before the end of the year. The letter says that the CDC had entered a contract with McKesson Corp. to distribute hundreds of millions of vaccine doses to state and local health departments nationwide in less than two months, according to NBC News.
The New York Times obtained a planning document that the CDC sent out. It described an evolving vaccine landscape, but touted the promise of two different vaccine candidates, and laid out a scenario where 2 million doses could be distributed before November and another 10 to 20 million doses distributed by the end of that month.
Both vaccine candidates would require two injections taken a couple of weeks apart and it identified at-risk populations and frontline workers as the people to receive the vaccine first.
“These scenarios are designed to support jurisdictional, federal, and partner planning, but they are still considered hypothetical,” one document reads, as CNN reported.
In the documents, Redfield asks governors to expedite applications for the vaccine distribution facilities that McKesson would run, according to NBC News.
“If necessary,” Redfield wrote, the agency “asks you to consider waiving requirements that would prevent these facilities from being fully operational by November 1, 2020,” as NBC News reported.
Public health officials worry that the Trump administration is looking to roll out a vaccine prematurely, or at least to hype one, before the election as a way to score political points, as The New York Times noted. There are Herculean logistical challenges involved in distributing and storing a vaccine in sub-zero temperatures to a messy and disjointed healthcare system.
“This timeline of the initial deployment at the end of October is deeply worrisome for the politicization of public health and the potential safety ramifications,” said Saskia Popescu, an infection prevention epidemiologist based in Arizona, to The New York Times. “It’s hard not to see this as a push for a pre-election vaccine.”
Director of the National Institutes of Health Dr. Francis Collins, however, told CNN that he doesn’t see it as a premature rush to distribute a vaccine. He said it’s proper planning should one of the two vaccine candidates tested show fast, clear evidence that it is protecting people.
“Now, keep in mind that the likelihood of that is pretty low,” Collins told CNN. “This is like the Boy Scout motto, ‘Be Prepared.'”
“Even if it’s very low likelihood, if everything happened to come together really beautifully and we had an answer by then and we knew we had a vaccine that was safe and effective, wouldn’t you want people to be ready to figure out how to do the distribution? That’s all that CDC is saying,” he added.
Medical experts did appreciate that the CDC earmarked the first vaccines for healthcare workers, essential workers and people who work in national security, according to The New York Times. The guidelines also said early vaccines should go to older people, indigenous people, minority groups and to prison populations — all communities that have been most affected by the novel coronavirus.
That specific direction is beneficial for public health, “so it doesn’t just all wind up in high-income, affluent suburbs,” said Dr. Cedric Dark, an emergency medicine physician at Baylor College of Medicine in Texas, to The New York Times.
- U.S. Refuses to Join Global Coronavirus Vaccine Efforts - EcoWatch
- CDC Data Censorship Sparks Outcry, Forces HHS to Reverse Course
- As CDC Says 'Do Not Go to Work,' Trump Says Thousands With ...
- FDA Issues Emergency Authorization to Treat COVID-19 With ...
- New CDC Guidelines Say Asymptomatic People Don't Need COVID ...
- Sanders Rips Trump's Push to Rush COVID Vaccine - EcoWatch
- WHO Releases Plans for COVID-19 Vaccine Distribution as U.S., China and Russia Opt Out - EcoWatch
- White House Blocks FDA Guidelines for COVID-19 Vaccine - EcoWatch