This website uses cookies to ensure you get the best experience while browsing it. By clicking 'Got It' you're accepting these terms.
Most recent
Trending
Top Videos

The best of EcoWatch, right in your inbox. Sign up for our email newsletter!
Phages: Bacterial Eaters From Georgia to Fight Antibiotic Resistance
By Tim Ruben Weimer
Tanja Diederen lives near Maastricht in the Netherlands. She has been suffering from Hidradenitis suppurativa for 30 years. Its a chronic skin disease in which the hair roots are inflamed under pain — often around the armpits and on the chest.
€3,900 ($4,302) for treatment in Georgia
In August 2019, the now 50-year-old made a radical decision: she discontinued the antibiotics, which were becoming less and less effective. And she traveled to Georgia for two weeks to undergo treatment with bacteriophages (or phages for short).
Such phage therapy is not yet approved in most Western European countries. She paid 3,900 euros out of her own pocket in the hope that the unconventional therapy would help her.
Bacteriophages are viruses that fight against the proliferation of their host bacteria. Therapy with bacteriophages involves the oral administration of a single, isolated type of phage. They attach themselves to their bacterial counterparts in the patient's body in order to survive.
The phages reverse the polarity of the bacterial cell in such a way that it produces further phages, filling up with more and more phages and finally bursts. Then, the released phages attach themselves to other bacteria until all of the bacteria has been destroyed.
Journey Into the Unknown
"It tastes a bit like mushrooms," Tanja Diederen remarked as she took her morning phage dose. "When I went to Georgia, I was at first very nervous and excited, but above all disappointed about the treatment here in Holland."
After antibiotics stopped working for her, her doctor suggested that she take biopharmaceuticals, i.e. genetically engineered drugs. He had never heard of bacteriophages.
Instead, Diederen decided to look for treatment options with bacteriophages on her own, which she had heard about in a television program.
The Doctor Never Heard of Phages
A phage model — phages are viruses, that multiply in bacteria and then destroy them.
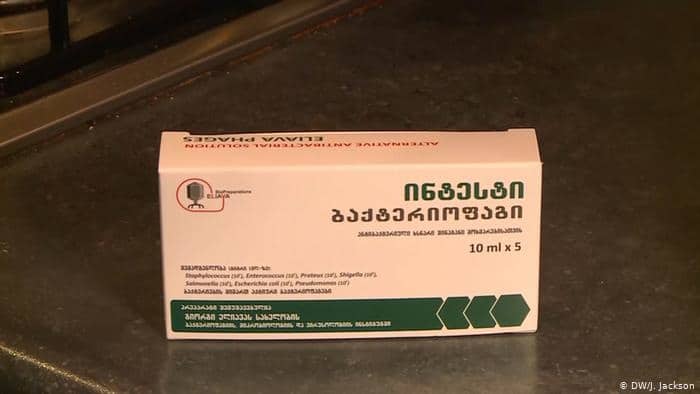
She came across the Georgi-Eliava Institute in Georgia, which has been researching bacteriophages since 1923 — just a few years after their discovery. Georgia has since developed into the global center of phage therapy.
During the Cold War, antibiotics were difficult to get there or anywhere in the Soviet Union. Treatment with phages was the best way to cure infectious diseases. Today, the Eliava Institute has one of the largest therapeutic collections of bacteriophages in the world.
Tanja Diederen stayed in treatment for two weeks, after which she traveled back to the Netherlands with a large suitcase full of phage tins. Since she began taking two different phages a day and applying a cream, she feels better.
She has more energy again and the small inflammations on her chest and armpits have decreased. The large inflammations come and go, but not as severe as before.
"It Doesn't Feel Illegal to Me"
Communicating with the Georgian doctors was difficult for Tanja Diederen. She needed a translator.
Every three months Diederen travels to Belgium — 15 kilometers away — to pick up a new ration of bacteriophages sent from Georgia for 500 euros. Her health insurance doesn't pay for this. Belgium is the only Western European country where phages are allowed. In the Netherlands, as in all other countries, they can only be used in individual cases to save lives or relieve severe pain.
Her physician is solely responsible for the application.
"It doesn't feel illegal to me," said Diederen. "I am one hundred percent sure that this medicine will help many people."
Like antibiotics, bacteriophages can also lead to bacterial resistance. Their big advantage, however, is that they are always one step ahead of the bacteria and can overcome the resistance. In addition, they are always directed against a specific type of bacteria and thus leave useful bacteria undamaged, like in the intestine, for example.
Before phage treatment, it is always necessary to determine which bacteria actually trigger the disease. The phages are then produced individually for each patient — often in Georgia.
Bacteriophages Permitted in Belgium
Professor Jean-Paul Pirnay from the Queen-Astrid Military Hospital in Brussels works with bacteriophages.
Such an individual medication does not meet the applicable regulations for medicinal products in any Western European country. It would take too much effort to have each individual phage formulation approved by the authorities.
Not so in Belgium. Since last year, this process can be legally circumvented by the Scientific Health Institute, in cooperation with doctors, patients, manufacturers, pharmacists and the Belgian Federal Office for Medicinal Products, issuing a certificate for the required phage ingredients. Pharmacists will then be able to use them for the manufacture of bacteriophages, subject to certain guidelines.
"We have used the existing legal framework to insert the bacteriophages," said Dr Jean-Paul Pirnay, who works at the Queen Astrid Military Hospital in Brussels on bacteriophages.
Around 30 patients have already been treated there. Currently, the military hospital is the only place in Belgium where bacteriophages are produced.
Useful Supplement to Antibiotics
"We need pharmaceutical companies to make the phage," says Pirnay. "A hospital can't produce all phages for a growing number of patients."
But industrial production of phages would require a clearer legal framework, and research is not yet ready.
"I believe that phages will not replace antibiotics," he said. "Both will be used together to make antibiotics more effective."
Tanja Diederen wants to continue her treatment in Brussels in the future. Communication with the Georgian doctors was difficult for her, she always needed a translator.
"I really hope that phages will soon be allowed in Europe," she said. "Going to Georgia is quite difficult and expensive."
Germany and the Netherlands are currently conducting pilot studies to see whether an individual prescription of bacteriophages would be possible. France has already imported Belgian phages and agreed to their use.
Reposted with permission from Deutsche Welle.
- Wastewater Treatment Plants Could Contribute to a 'Post-Antibiotic ... ›
- Here's How Bad Antibiotic Resistance Has Gotten Over the Past 20 ... ›
EcoWatch Daily Newsletter
A rare yellow penguin has been photographed for what is believed to be the first time.
- World-Renowned Photographer Documents Most Remote ... ›
- This Penguin Colony Has Fallen by 77% on Antarctic Islands ... ›
By Stuart Braun
We spend 90% of our time in the buildings where we live and work, shop and conduct business, in the structures that keep us warm in winter and cool in summer.
But immense energy is required to source and manufacture building materials, to power construction sites, to maintain and renew the built environment. In 2019, building operations and construction activities together accounted for 38% of global energy-related CO2 emissions, the highest level ever recorded.
- Could IKEA's New Tiny House Help Fight the Climate Crisis ... ›
- Los Angeles City-Owned Buildings to Go 100% Carbon Free ... ›
- New Jersey Will Be First State to Require Building Permits to ... ›
By Eric Tate and Christopher Emrich
Disasters stemming from hazards like floods, wildfires, and disease often garner attention because of their extreme conditions and heavy societal impacts. Although the nature of the damage may vary, major disasters are alike in that socially vulnerable populations often experience the worst repercussions. For example, we saw this following Hurricanes Katrina and Harvey, each of which generated widespread physical damage and outsized impacts to low-income and minority survivors.
Mapping Social Vulnerability
<p>Figure 1a is a typical map of social vulnerability across the United States at the census tract level based on the Social Vulnerability Index (SoVI) algorithm of <a href="https://onlinelibrary.wiley.com/doi/abs/10.1111/1540-6237.8402002" target="_blank"><em>Cutter et al.</em></a> [2003]. Spatial representation of the index depicts high social vulnerability regionally in the Southwest, upper Great Plains, eastern Oklahoma, southern Texas, and southern Appalachia, among other places. With such a map, users can focus attention on select places and identify population characteristics associated with elevated vulnerabilities.</p>Fig. 1. (a) Social vulnerability across the United States at the census tract scale is mapped here following the Social Vulnerability Index (SoVI). Red and pink hues indicate high social vulnerability. (b) This bivariate map depicts social vulnerability (blue hues) and annualized per capita hazard losses (pink hues) for U.S. counties from 2010 to 2019.
<p>Many current indexes in the United States and abroad are direct or conceptual offshoots of SoVI, which has been widely replicated [e.g., <a href="https://link.springer.com/article/10.1007/s13753-016-0090-9" target="_blank"><em>de Loyola Hummell et al.</em></a>, 2016]. The U.S. Centers for Disease Control and Prevention (CDC) <a href="https://www.atsdr.cdc.gov/placeandhealth/svi/index.html" target="_blank">has also developed</a> a commonly used social vulnerability index intended to help local officials identify communities that may need support before, during, and after disasters.</p><p>The first modeling and mapping efforts, starting around the mid-2000s, largely focused on describing spatial distributions of social vulnerability at varying geographic scales. Over time, research in this area came to emphasize spatial comparisons between social vulnerability and physical hazards [<a href="https://doi.org/10.1007/s11069-009-9376-1" target="_blank"><em>Wood et al.</em></a>, 2010], modeling population dynamics following disasters [<a href="https://link.springer.com/article/10.1007%2Fs11111-008-0072-y" target="_blank" rel="noopener noreferrer"><em>Myers et al.</em></a>, 2008], and quantifying the robustness of social vulnerability measures [<a href="https://doi.org/10.1007/s11069-012-0152-2" target="_blank" rel="noopener noreferrer"><em>Tate</em></a>, 2012].</p><p>More recent work is beginning to dissolve barriers between social vulnerability and environmental justice scholarship [<a href="https://doi.org/10.2105/AJPH.2018.304846" target="_blank" rel="noopener noreferrer"><em>Chakraborty et al.</em></a>, 2019], which has traditionally focused on root causes of exposure to pollution hazards. Another prominent new research direction involves deeper interrogation of social vulnerability drivers in specific hazard contexts and disaster phases (e.g., before, during, after). Such work has revealed that interactions among drivers are important, but existing case studies are ill suited to guiding development of new indicators [<a href="https://doi.org/10.1016/j.ijdrr.2015.09.013" target="_blank" rel="noopener noreferrer"><em>Rufat et al.</em></a>, 2015].</p><p>Advances in geostatistical analyses have enabled researchers to characterize interactions more accurately among social vulnerability and hazard outcomes. Figure 1b depicts social vulnerability and annualized per capita hazard losses for U.S. counties from 2010 to 2019, facilitating visualization of the spatial coincidence of pre‑event susceptibilities and hazard impacts. Places ranked high in both dimensions may be priority locations for management interventions. Further, such analysis provides invaluable comparisons between places as well as information summarizing state and regional conditions.</p><p>In Figure 2, we take the analysis of interactions a step further, dividing counties into two categories: those experiencing annual per capita losses above or below the national average from 2010 to 2019. The differences among individual race, ethnicity, and poverty variables between the two county groups are small. But expressing race together with poverty (poverty attenuated by race) produces quite different results: Counties with high hazard losses have higher percentages of both impoverished Black populations and impoverished white populations than counties with low hazard losses. These county differences are most pronounced for impoverished Black populations.</p>Fig. 2. Differences in population percentages between counties experiencing annual per capita losses above or below the national average from 2010 to 2019 for individual and compound social vulnerability indicators (race and poverty).
<p>Our current work focuses on social vulnerability to floods using geostatistical modeling and mapping. The research directions are twofold. The first is to develop hazard-specific indicators of social vulnerability to aid in mitigation planning [<a href="https://doi.org/10.1007/s11069-020-04470-2" target="_blank" rel="noopener noreferrer"><em>Tate et al.</em></a>, 2021]. Because natural hazards differ in their innate characteristics (e.g., rate of onset, spatial extent), causal processes (e.g., urbanization, meteorology), and programmatic responses by government, manifestations of social vulnerability vary across hazards.</p><p>The second is to assess the degree to which socially vulnerable populations benefit from the leading disaster recovery programs [<a href="https://doi.org/10.1080/17477891.2019.1675578" target="_blank" rel="noopener noreferrer"><em>Emrich et al.</em></a>, 2020], such as the Federal Emergency Management Agency's (FEMA) <a href="https://www.fema.gov/individual-disaster-assistance" target="_blank" rel="noopener noreferrer">Individual Assistance</a> program and the U.S. Department of Housing and Urban Development's Community Development Block Grant (CDBG) <a href="https://www.hudexchange.info/programs/cdbg-dr/" target="_blank" rel="noopener noreferrer">Disaster Recovery</a> program. Both research directions posit social vulnerability indicators as potential measures of social equity.</p>Social Vulnerability as a Measure of Equity
<p>Given their focus on social marginalization and economic barriers, social vulnerability indicators are attracting growing scientific interest as measures of inequity resulting from disasters. Indeed, social vulnerability and inequity are related concepts. Social vulnerability research explores the differential susceptibilities and capacities of disaster-affected populations, whereas social equity analyses tend to focus on population disparities in the allocation of resources for hazard mitigation and disaster recovery. Interventions with an equity focus emphasize full and equal resource access for all people with unmet disaster needs.</p><p>Yet newer studies of inequity in disaster programs have documented troubling disparities in income, race, and home ownership among those who <a href="https://eos.org/articles/equity-concerns-raised-in-federal-flood-property-buyouts" target="_blank">participate in flood buyout programs</a>, are <a href="https://www.eenews.net/stories/1063477407" target="_blank" rel="noopener noreferrer">eligible for postdisaster loans</a>, receive short-term recovery assistance [<a href="https://doi.org/10.1016/j.ijdrr.2020.102010" target="_blank" rel="noopener noreferrer"><em>Drakes et al.</em></a>, 2021], and have <a href="https://www.texastribune.org/2020/08/25/texas-natural-disasters--mental-health/" target="_blank" rel="noopener noreferrer">access to mental health services</a>. For example, a recent analysis of federal flood buyouts found racial privilege to be infused at multiple program stages and geographic scales, resulting in resources that disproportionately benefit whiter and more urban counties and neighborhoods [<a href="https://doi.org/10.1177/2378023120905439" target="_blank" rel="noopener noreferrer"><em>Elliott et al.</em></a>, 2020].</p><p>Investments in disaster risk reduction are largely prioritized on the basis of hazard modeling, historical impacts, and economic risk. Social equity, meanwhile, has been far less integrated into the considerations of public agencies for hazard and disaster management. But this situation may be beginning to shift. Following the adage of "what gets measured gets managed," social equity metrics are increasingly being inserted into disaster management.</p><p>At the national level, FEMA has <a href="https://www.fema.gov/news-release/20200220/fema-releases-affordability-framework-national-flood-insurance-program" target="_blank">developed options</a> to increase the affordability of flood insurance [Federal Emergency Management Agency, 2018]. At the subnational scale, Puerto Rico has integrated social vulnerability into its CDBG Mitigation Action Plan, expanding its considerations of risk beyond only economic factors. At the local level, Harris County, Texas, has begun using social vulnerability indicators alongside traditional measures of flood risk to introduce equity into the prioritization of flood mitigation projects [<a href="https://www.hcfcd.org/Portals/62/Resilience/Bond-Program/Prioritization-Framework/final_prioritization-framework-report_20190827.pdf?ver=2019-09-19-092535-743" target="_blank" rel="noopener noreferrer"><em>Harris County Flood Control District</em></a>, 2019].</p><p>Unfortunately, many existing measures of disaster equity fall short. They may be unidimensional, using single indicators such as income in places where underlying vulnerability processes suggest that a multidimensional measure like racialized poverty (Figure 2) would be more valid. And criteria presumed to be objective and neutral for determining resource allocation, such as economic loss and cost-benefit ratios, prioritize asset value over social equity. For example, following the <a href="http://www.cedar-rapids.org/discover_cedar_rapids/flood_of_2008/2008_flood_facts.php" target="_blank" rel="noopener noreferrer">2008 flooding</a> in Cedar Rapids, Iowa, cost-benefit criteria supported new flood protections for the city's central business district on the east side of the Cedar River but not for vulnerable populations and workforce housing on the west side.</p><p>Furthermore, many equity measures are aspatial or ahistorical, even though the roots of marginalization may lie in systemic and spatially explicit processes that originated long ago like redlining and urban renewal. More research is thus needed to understand which measures are most suitable for which social equity analyses.</p>Challenges for Disaster Equity Analysis
<p>Across studies that quantify, map, and analyze social vulnerability to natural hazards, modelers have faced recurrent measurement challenges, many of which also apply in measuring disaster equity (Table 1). The first is clearly establishing the purpose of an equity analysis by defining characteristics such as the end user and intended use, the type of hazard, and the disaster stage (i.e., mitigation, response, or recovery). Analyses using generalized indicators like the CDC Social Vulnerability Index may be appropriate for identifying broad areas of concern, whereas more detailed analyses are ideal for high-stakes decisions about budget allocations and project prioritization.</p>Wisconsin will end its controversial wolf hunt early after hunters and trappers killed almost 70 percent of the state's quota in the hunt's first 48 hours.
Trending
By Jessica Corbett
Sen. Bernie Sanders on Tuesday was the lone progressive to vote against Tom Vilsack reprising his role as secretary of agriculture, citing concerns that progressive advocacy groups have been raising since even before President Joe Biden officially nominated the former Obama administration appointee.