
By Raffaella Tolicetti
With reproductive instincts pushing them towards the Colorado River Delta, thousands of corvina fish are currently swimming with the tide along the coastal waters of the Pacific Ocean. Making their way to the estuaries, where fresh water mixes with the saline components of the seas, these corvina are unaware that many of them will not even get the chance to lay their eggs in the very particular habitat they depend on to reproduce.
Classified as vulnerable by the IUCN Red List of Threatened Species, corvina have been victims from overfishing since the 90's. Law enforcement agencies struggle to monitor their catch, despite a regulation that limits the amount of fish that can be removed from the sea.
Covina are a marvel of nature. Their spawning rhythm is synchronized with the moon and tide cycles, transforming the calm seas of the Gulf of California into a rollicking theater as they emit their distinctive croaking sounds to communicate spawning readiness and begin to organize their formations.
Unfortunately, this spectacle also signals the fishermen, who lay nets by the thousands, waiting for this exact moment to begin catching corvina by the tons.
These fish are surrounded by an army of small boats (745 of which are legal, but the government agencies estimates that at least 1,000 pangas go out fishing) and have no chance against the nets that will catch any moving animal in the area.
How can fishing during spawning season be justified? Studies show a constant decrease of the average fish size, with more and more juveniles caught, as the adults don't have time to reproduce.
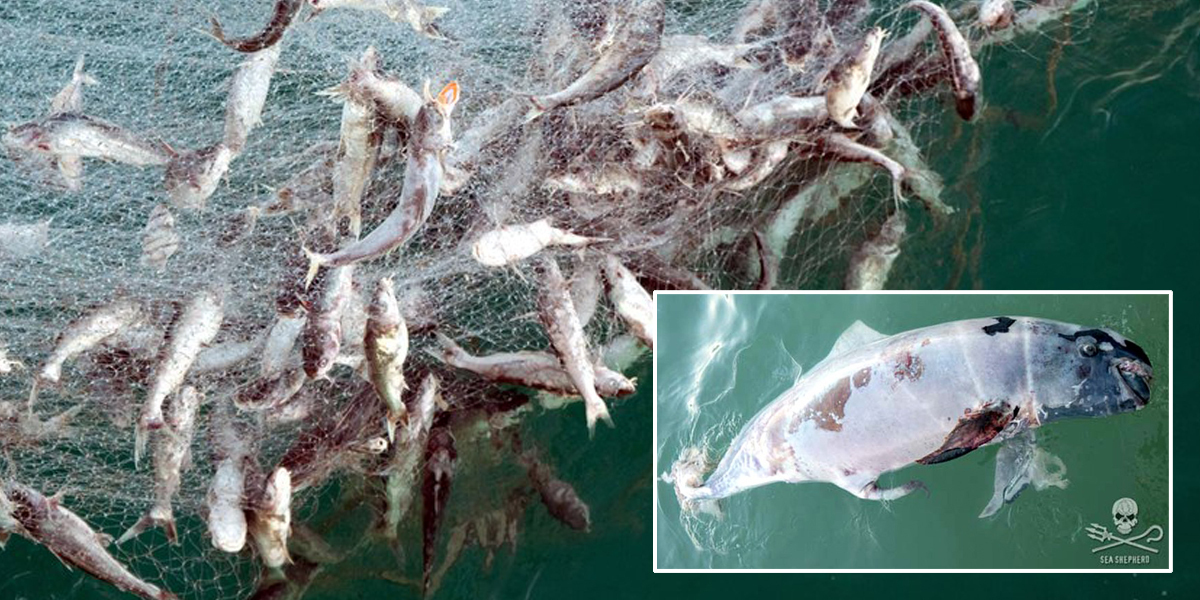
The results of this large scale fisheries is not only the devastation of a fish population, but other animals who are also at risk and targeted by this frenetic activity, including the shy and elusive vaquita marina. This small porpoise only lives on the coast of San Felipe, in the Gulf of California, and is considered the most endangered marine mammal in the world. Its habitat has been fragmented by gill nets, to the point of bringing the numbers of vaquita down to only 30 individuals. This species is now on the verge of extinction.
Gill nets, which have been forbidden in the upper part of the Gulf since 2015, are mainly used to fish another endangered, endemic animal of the Gulf: the totoaba bass, sought for its bladder, and not for its meat. This bladder is sold at high value on the black market in China and Hong Kong, and the rest of this predator is thrown back, bleeding, in to the sea.
These banned gill nets are the cause of death of many animals that get trapped in them, including the vaquita. Last year the only sightings of this marine mammal were three dead individuals whose cause of death was determined by scientists as being due to entanglement in gill nets, which traps them and prevents them to come up to the surface for air. They literally suffocate to death.
3 #Vaquitas Found Dead: The Most Endangered Marine Mammal in the World https://t.co/0feJaAJTma @seashepherd @oceana https://t.co/CjaWLjVRR3— EcoWatch (@EcoWatch)1459259213.0
Efforts are being made in order to keep the refuge a safe place from the nets. It is therefore imperative that adequate law enforcement measures are put in to place, including, reporting illegal activity in the area and apprehending those engaged in it. Sea Shepherd is committed to keep patrolling and monitoring the refuge, and to remove every illegal net encountered.
The Gulf of California is a stunning place where the desert is bathed by a beautiful sea, often described as the aquarium of the planet. If our relationship to it doesn't change immediately, it will soon be turned into an open-air cemetery, reminiscent of a world that once was, and is no more.
Raffaella Tolicetti is the ship manager on the M/V Sam Simon. The M/V Sam Simon and the M/V Farley Mowat are in the Gulf of California for Operation Milaro III.
A rare yellow penguin has been photographed for what is believed to be the first time.
- World-Renowned Photographer Documents Most Remote ... ›
- This Penguin Colony Has Fallen by 77% on Antarctic Islands ... ›
EcoWatch Daily Newsletter
By Stuart Braun
We spend 90% of our time in the buildings where we live and work, shop and conduct business, in the structures that keep us warm in winter and cool in summer.
But immense energy is required to source and manufacture building materials, to power construction sites, to maintain and renew the built environment. In 2019, building operations and construction activities together accounted for 38% of global energy-related CO2 emissions, the highest level ever recorded.
- Could IKEA's New Tiny House Help Fight the Climate Crisis ... ›
- Los Angeles City-Owned Buildings to Go 100% Carbon Free ... ›
- New Jersey Will Be First State to Require Building Permits to ... ›
Trending
By Eric Tate and Christopher Emrich
Disasters stemming from hazards like floods, wildfires, and disease often garner attention because of their extreme conditions and heavy societal impacts. Although the nature of the damage may vary, major disasters are alike in that socially vulnerable populations often experience the worst repercussions. For example, we saw this following Hurricanes Katrina and Harvey, each of which generated widespread physical damage and outsized impacts to low-income and minority survivors.
Mapping Social Vulnerability
<p>Figure 1a is a typical map of social vulnerability across the United States at the census tract level based on the Social Vulnerability Index (SoVI) algorithm of <a href="https://onlinelibrary.wiley.com/doi/abs/10.1111/1540-6237.8402002" target="_blank"><em>Cutter et al.</em></a> [2003]. Spatial representation of the index depicts high social vulnerability regionally in the Southwest, upper Great Plains, eastern Oklahoma, southern Texas, and southern Appalachia, among other places. With such a map, users can focus attention on select places and identify population characteristics associated with elevated vulnerabilities.</p>Fig. 1. (a) Social vulnerability across the United States at the census tract scale is mapped here following the Social Vulnerability Index (SoVI). Red and pink hues indicate high social vulnerability. (b) This bivariate map depicts social vulnerability (blue hues) and annualized per capita hazard losses (pink hues) for U.S. counties from 2010 to 2019.
<p>Many current indexes in the United States and abroad are direct or conceptual offshoots of SoVI, which has been widely replicated [e.g., <a href="https://link.springer.com/article/10.1007/s13753-016-0090-9" target="_blank"><em>de Loyola Hummell et al.</em></a>, 2016]. The U.S. Centers for Disease Control and Prevention (CDC) <a href="https://www.atsdr.cdc.gov/placeandhealth/svi/index.html" target="_blank">has also developed</a> a commonly used social vulnerability index intended to help local officials identify communities that may need support before, during, and after disasters.</p><p>The first modeling and mapping efforts, starting around the mid-2000s, largely focused on describing spatial distributions of social vulnerability at varying geographic scales. Over time, research in this area came to emphasize spatial comparisons between social vulnerability and physical hazards [<a href="https://doi.org/10.1007/s11069-009-9376-1" target="_blank"><em>Wood et al.</em></a>, 2010], modeling population dynamics following disasters [<a href="https://link.springer.com/article/10.1007%2Fs11111-008-0072-y" target="_blank" rel="noopener noreferrer"><em>Myers et al.</em></a>, 2008], and quantifying the robustness of social vulnerability measures [<a href="https://doi.org/10.1007/s11069-012-0152-2" target="_blank" rel="noopener noreferrer"><em>Tate</em></a>, 2012].</p><p>More recent work is beginning to dissolve barriers between social vulnerability and environmental justice scholarship [<a href="https://doi.org/10.2105/AJPH.2018.304846" target="_blank" rel="noopener noreferrer"><em>Chakraborty et al.</em></a>, 2019], which has traditionally focused on root causes of exposure to pollution hazards. Another prominent new research direction involves deeper interrogation of social vulnerability drivers in specific hazard contexts and disaster phases (e.g., before, during, after). Such work has revealed that interactions among drivers are important, but existing case studies are ill suited to guiding development of new indicators [<a href="https://doi.org/10.1016/j.ijdrr.2015.09.013" target="_blank" rel="noopener noreferrer"><em>Rufat et al.</em></a>, 2015].</p><p>Advances in geostatistical analyses have enabled researchers to characterize interactions more accurately among social vulnerability and hazard outcomes. Figure 1b depicts social vulnerability and annualized per capita hazard losses for U.S. counties from 2010 to 2019, facilitating visualization of the spatial coincidence of pre‑event susceptibilities and hazard impacts. Places ranked high in both dimensions may be priority locations for management interventions. Further, such analysis provides invaluable comparisons between places as well as information summarizing state and regional conditions.</p><p>In Figure 2, we take the analysis of interactions a step further, dividing counties into two categories: those experiencing annual per capita losses above or below the national average from 2010 to 2019. The differences among individual race, ethnicity, and poverty variables between the two county groups are small. But expressing race together with poverty (poverty attenuated by race) produces quite different results: Counties with high hazard losses have higher percentages of both impoverished Black populations and impoverished white populations than counties with low hazard losses. These county differences are most pronounced for impoverished Black populations.</p>Fig. 2. Differences in population percentages between counties experiencing annual per capita losses above or below the national average from 2010 to 2019 for individual and compound social vulnerability indicators (race and poverty).
<p>Our current work focuses on social vulnerability to floods using geostatistical modeling and mapping. The research directions are twofold. The first is to develop hazard-specific indicators of social vulnerability to aid in mitigation planning [<a href="https://doi.org/10.1007/s11069-020-04470-2" target="_blank" rel="noopener noreferrer"><em>Tate et al.</em></a>, 2021]. Because natural hazards differ in their innate characteristics (e.g., rate of onset, spatial extent), causal processes (e.g., urbanization, meteorology), and programmatic responses by government, manifestations of social vulnerability vary across hazards.</p><p>The second is to assess the degree to which socially vulnerable populations benefit from the leading disaster recovery programs [<a href="https://doi.org/10.1080/17477891.2019.1675578" target="_blank" rel="noopener noreferrer"><em>Emrich et al.</em></a>, 2020], such as the Federal Emergency Management Agency's (FEMA) <a href="https://www.fema.gov/individual-disaster-assistance" target="_blank" rel="noopener noreferrer">Individual Assistance</a> program and the U.S. Department of Housing and Urban Development's Community Development Block Grant (CDBG) <a href="https://www.hudexchange.info/programs/cdbg-dr/" target="_blank" rel="noopener noreferrer">Disaster Recovery</a> program. Both research directions posit social vulnerability indicators as potential measures of social equity.</p>Social Vulnerability as a Measure of Equity
<p>Given their focus on social marginalization and economic barriers, social vulnerability indicators are attracting growing scientific interest as measures of inequity resulting from disasters. Indeed, social vulnerability and inequity are related concepts. Social vulnerability research explores the differential susceptibilities and capacities of disaster-affected populations, whereas social equity analyses tend to focus on population disparities in the allocation of resources for hazard mitigation and disaster recovery. Interventions with an equity focus emphasize full and equal resource access for all people with unmet disaster needs.</p><p>Yet newer studies of inequity in disaster programs have documented troubling disparities in income, race, and home ownership among those who <a href="https://eos.org/articles/equity-concerns-raised-in-federal-flood-property-buyouts" target="_blank">participate in flood buyout programs</a>, are <a href="https://www.eenews.net/stories/1063477407" target="_blank" rel="noopener noreferrer">eligible for postdisaster loans</a>, receive short-term recovery assistance [<a href="https://doi.org/10.1016/j.ijdrr.2020.102010" target="_blank" rel="noopener noreferrer"><em>Drakes et al.</em></a>, 2021], and have <a href="https://www.texastribune.org/2020/08/25/texas-natural-disasters--mental-health/" target="_blank" rel="noopener noreferrer">access to mental health services</a>. For example, a recent analysis of federal flood buyouts found racial privilege to be infused at multiple program stages and geographic scales, resulting in resources that disproportionately benefit whiter and more urban counties and neighborhoods [<a href="https://doi.org/10.1177/2378023120905439" target="_blank" rel="noopener noreferrer"><em>Elliott et al.</em></a>, 2020].</p><p>Investments in disaster risk reduction are largely prioritized on the basis of hazard modeling, historical impacts, and economic risk. Social equity, meanwhile, has been far less integrated into the considerations of public agencies for hazard and disaster management. But this situation may be beginning to shift. Following the adage of "what gets measured gets managed," social equity metrics are increasingly being inserted into disaster management.</p><p>At the national level, FEMA has <a href="https://www.fema.gov/news-release/20200220/fema-releases-affordability-framework-national-flood-insurance-program" target="_blank">developed options</a> to increase the affordability of flood insurance [Federal Emergency Management Agency, 2018]. At the subnational scale, Puerto Rico has integrated social vulnerability into its CDBG Mitigation Action Plan, expanding its considerations of risk beyond only economic factors. At the local level, Harris County, Texas, has begun using social vulnerability indicators alongside traditional measures of flood risk to introduce equity into the prioritization of flood mitigation projects [<a href="https://www.hcfcd.org/Portals/62/Resilience/Bond-Program/Prioritization-Framework/final_prioritization-framework-report_20190827.pdf?ver=2019-09-19-092535-743" target="_blank" rel="noopener noreferrer"><em>Harris County Flood Control District</em></a>, 2019].</p><p>Unfortunately, many existing measures of disaster equity fall short. They may be unidimensional, using single indicators such as income in places where underlying vulnerability processes suggest that a multidimensional measure like racialized poverty (Figure 2) would be more valid. And criteria presumed to be objective and neutral for determining resource allocation, such as economic loss and cost-benefit ratios, prioritize asset value over social equity. For example, following the <a href="http://www.cedar-rapids.org/discover_cedar_rapids/flood_of_2008/2008_flood_facts.php" target="_blank" rel="noopener noreferrer">2008 flooding</a> in Cedar Rapids, Iowa, cost-benefit criteria supported new flood protections for the city's central business district on the east side of the Cedar River but not for vulnerable populations and workforce housing on the west side.</p><p>Furthermore, many equity measures are aspatial or ahistorical, even though the roots of marginalization may lie in systemic and spatially explicit processes that originated long ago like redlining and urban renewal. More research is thus needed to understand which measures are most suitable for which social equity analyses.</p>Challenges for Disaster Equity Analysis
<p>Across studies that quantify, map, and analyze social vulnerability to natural hazards, modelers have faced recurrent measurement challenges, many of which also apply in measuring disaster equity (Table 1). The first is clearly establishing the purpose of an equity analysis by defining characteristics such as the end user and intended use, the type of hazard, and the disaster stage (i.e., mitigation, response, or recovery). Analyses using generalized indicators like the CDC Social Vulnerability Index may be appropriate for identifying broad areas of concern, whereas more detailed analyses are ideal for high-stakes decisions about budget allocations and project prioritization.</p>Wisconsin will end its controversial wolf hunt early after hunters and trappers killed almost 70 percent of the state's quota in the hunt's first 48 hours.
By Jessica Corbett
Sen. Bernie Sanders on Tuesday was the lone progressive to vote against Tom Vilsack reprising his role as secretary of agriculture, citing concerns that progressive advocacy groups have been raising since even before President Joe Biden officially nominated the former Obama administration appointee.