
 568k
568k  233k
233k  41k
41k  Subscribe
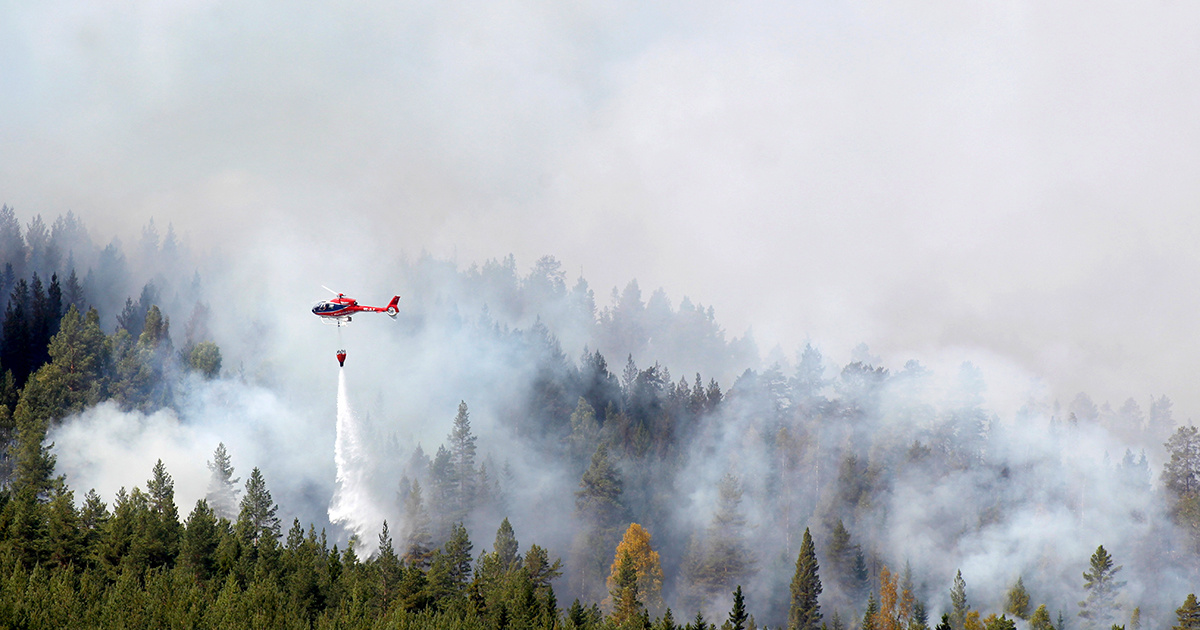
Firefighters battle a blaze in a forest in western Sweden, the worst-hit country. Mats Andersson / Getty Images
There are currently 11 wildfires blazing in the Arctic circle, The Guardian reported Wednesday.
While fires are also raging in Russia, Norway and Finland, Sweden has seen the most extensive Arctic fires, which have forced four communities to evacuate, according to The Guardian.
Two Italian water-bombing planes that answered Sweden’s call for help will begin operating Wednesday, but Sweden’s Civil Contingencies Agency has requested even more planes and helicopters from the EU, The Local Sweden reported.
“This is definitely the worst year in recent times for forest fires. Whilst we get them every year, 2018 is shaping up to be excessive,” university researcher and Uppsula resident Mike Peacock told The Guardian.
This year’s fires in Sweden cover a much larger area than fires in past years, The Guardian reported.
The fires come as a consequence of a heat wave that is bringing unusually hot, dry weather to much of Europe, conflagrations far outside of Europe’s Mediterranean firezone, EU officials said, according to The Guardian.
The European Forest Fire Information System has warned that fire conditions will persist in central and northern Europe over the next few weeks.
Scientists say the increase in northern fires is another sign of climate change.
“What we’re seeing with this global heatwave is that these areas of fire susceptibility are now broadening, with the moors in north-west England and now these Swedish fires a consequence of that,” professor of global change ecology at the Open University Vincent Gauci told The Guardian.
“Both these areas are typically mild and wet which allows forests and peatlands to develop quite large carbon stores,” he said. “When such carbon-dense ecosystems experience aridity and heat and there is a source of ignition—lightning or people—fires will happen.”
The European Arctic isn’t the only part of the far north seeing increased fire activity.
Two fires that started Tuesday brought the total number of fires in Alaska’s Galena Zone up to 35, The Brookville Times reported. The fires have burned 44,000 acres to date.
The Alaskan fires and some of the Swedish fires were ignited by lightning strikes, which is in keeping with research published in 2017, which found that warmer temperatures were increasing thunderstorms over boreal forests and Arctic tundra, leading to more fires, Scientific American reported.
This year’s fires come a year after Europe had its worst fire season in recorded history, though 2017’s most devastating fires were in the more typical countries of Italy, Portugal and Spain, where they burned thousands of hectares of agricultural land and forests into November.