
 568k
568k  233k
233k  41k
41k  Subscribe
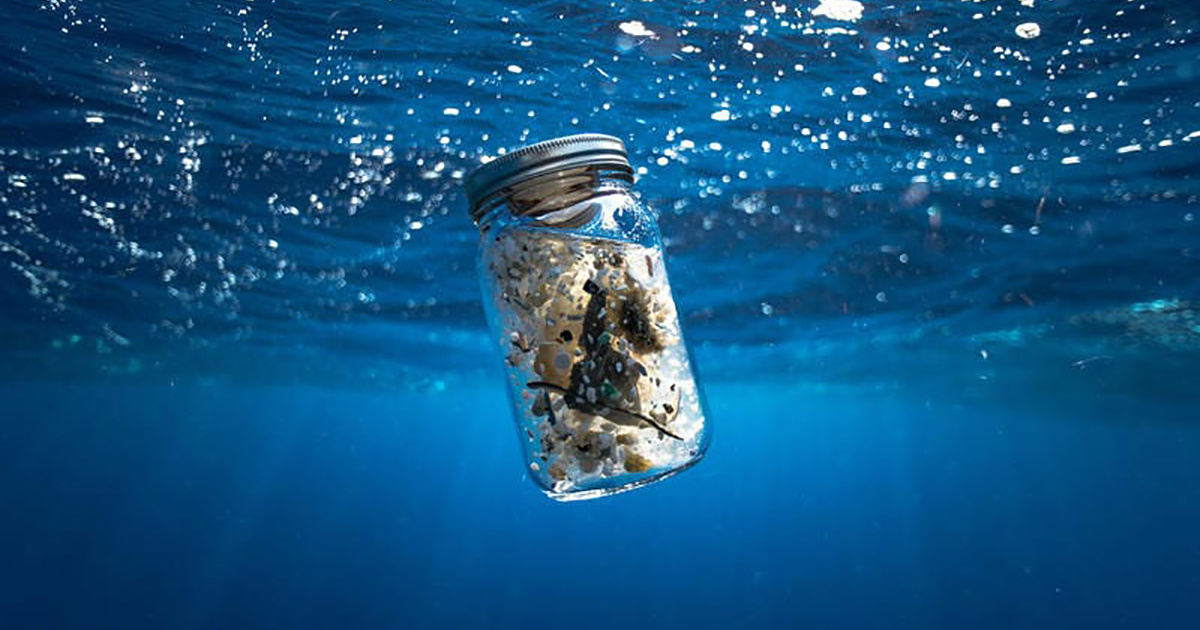
The crew of the Greenpeace ship MY Arctic Sunrise voyage into the Great Pacific Garbage Patch document plastics and other marine debris. The Great Pacific Garbage Patch is a soupy mix of plastics and microplastics, now twice the size of Texas, in the middle of the North Pacific Ocean. Justin Hofman / Greenpeace
By Perry Wheeler
Throughout this year, people all over the globe united to take on plastic pollution. Greenpeace supporters have asked their local supermarkets to phase out throwaway plastics, helped us reach 3 million signatures to companies like Coca-Cola, Nestle and Unilever demanding they invest in real solutions and participated in beach cleanups and brand audits to name the worst corporate plastic polluters.
Teen Vogue just released a comprehensive series that looks at the plastic pollution crisis and highlights the growing momentum to build a world beyond single-use plastics.
Here are three things that Teen Vogue nails about the plastic pollution fight:
1. It’s About Corporations, Not Individuals
For a long time, corporations have tried to put the onus on all of us to deal with plastic pollution. They created the narrative that recycling will solve this crisis, but to date, only 9 percent of the plastics that have ever been created have been recycled. They tell us not to litter but ignore the fact that no matter how their packaging gets into the environment, it will last for lifetimes.
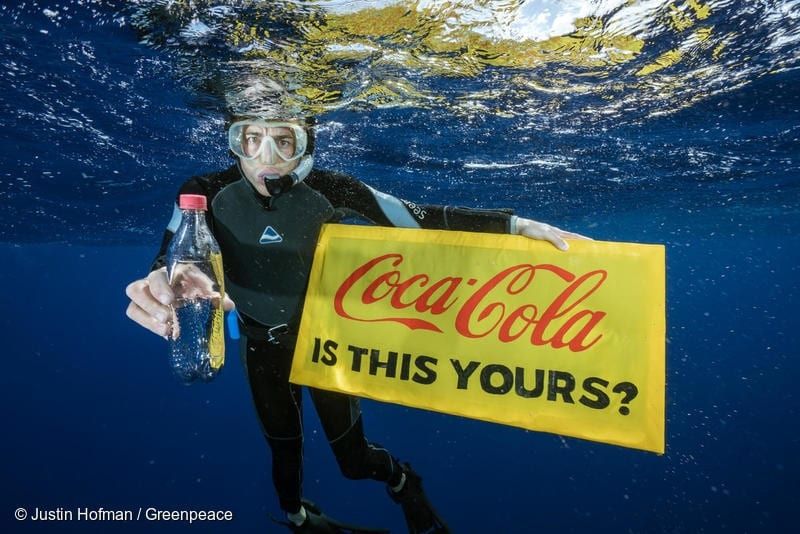
A Greenpeace diver holds a banner reading “Coca-Cola is this yours?” and a Coca-Cola bottle found adrift in the garbage patch.
Teen Vogue is spot on to highlight the need for corporate accountability on plastic pollution. That’s why we’re working with all of you and our allies in the Break Free From Plastic movement to hold cleanups and brand audits around the world. We need to name and publicly shame the worst corporate plastic polluters, and demand that they stop producing so much plastic to begin with. The world’s worst polluters must be transparent about their plastic footprints and take responsibility for their pollution. It’s time to cut off plastic production at the source.
2. We Can’t Just Clean Up the Ocean
Teen Vogue joined Greenpeace on its Arctic Sunrise ship to travel to the Great Pacific Garbage Patch and see what “thrown away” really looks like. The reality: a soupy mix of plastics and microplastics twice the size of Texas. While we were able to document some plastic at the surface and collected thousands of pieces of microplastics in the middle of the Pacific, the vast majority of plastic pollution sinks to the bottom of the ocean.
The Great Pacific Garbage Patch, and the oceans in general are impossible to just “clean up.” We simply produce too much plastic, and much of it is too difficult to even see. These microfibers and microplastics are consumed by marine animals, and many of us then eat plastics through seafood as well. We simply need to stop producing so much plastic.
If you had a bathtub that was overflowing with water, you would not immediately reach for a mop. You’d first cut off the water at the tap, which is what we need to do with plastic pollution.
Top 5 Myths of the Great Pacific Garbage Patch
youtu.be
3. The Throwaway Lifestyle is Just Not Sustainable
The issue actually goes much deeper than single-use plastics. Corporations have sold us on a throwaway lifestyle that trades moments of convenience for polluting or destroying our environment. We can no longer afford a throwaway lifestyle, and it’s going to take more than just swapping out one throwaway material for another. We need corporations to fundamentally rethink how they bring products to people, innovating around reuse and reduction.
The fight against plastic pollution has only just begun. We can’t rest when a corporation gets rid of plastic straws or a retailer phases out plastic bags. We need systemic change and for corporations to invest some of their profits into thinking through a world beyond throwaway plastics. Our oceans, waterways and communities depend on it.
Teen Vogue’s continuing series Plastic Planet addresses the plastic crisis plaguing our oceans—while offering solutions and ways you can do something about it. Keep an eye on their site for additional content this month.
Share with your friends and family, and on social too!