
 568k
568k  233k
233k  41k
41k  Subscribe
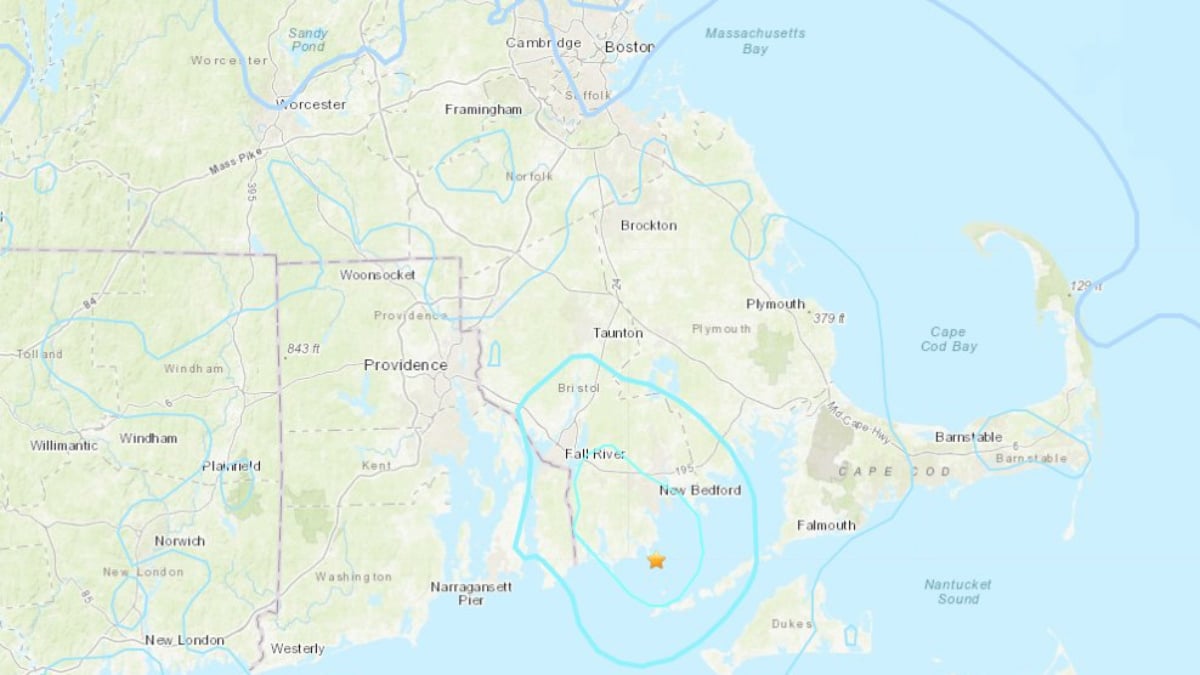
The 3.6 magnitude quake struck a few miles off the coast of New Bedford, Massachusetts. USGS
The biggest earthquake in decades rattled New England Sunday morning.
The 3.6 magnitude quake was epicentered a few miles off the coast of New Bedford, Massachusetts, according to NPR. No injuries were reported, but 21 people in New Bedford had to evacuate their homes because of minor structural damage, NBC10 Boston reported.
“I’ve never in my life experienced something so scary, ever in my life,” one New Bedford woman told NBC10 Boston. “Like something exploded and I thought like a car had hit my building.”
The quake struck around 9:10 a.m. at a depth of about 9.3 miles. It was felt across Massachusetts and Rhode Island, as well as in parts of Connecticut and Long Island, New York, CBS Boston reported. Around 14,000 people reported it to the U.S. Geological Survey (USGS) website.
“Earthquakes in this area are commonly felt very far away because the rocks in this area are very contiguous, very old, so they transmit the energy very well from earthquakes,” USGS geologist Paul Caruso told The New York Times.
Caruso said there had been 26 earthquakes in Southern New England since 1963. However, this was the largest since a 3.5 quake struck in March of 1976, Caruso told CBS Boston.
“This was the first earthquake I really felt in New England,” local seismologist Dr. Alan Kaftka told NBC10 Boston. He said smaller earthquakes in the region were common, but there had only been around nine earthquakes of a similar magnitude since the 1700s.
While no major damage was reported, there was some minor damage. The most dramatic involved collapsed chimneys in two New Bedford apartment buildings, displacing several families. The Red Cross said it was helping 21 people, including children, who had to find another place to stay because of earthquake damage in the city.
New Bedford Mayor Jon Mitchell said that structural damage was found in at least two homes in the city’s South End, CBS Boston reported.
Meteorologist and Rhode Island native Torry Gaucher tweeted that he found a crack in his basement.
Well that is a new stress crack… bummed that my house felt it but I didn’t since I was in the hot tub haha #earthquake2020 pic.twitter.com/RDi1fqvctn
— Torry Gaucher (@TorryGaucher) November 8, 2020
There is also a concern that more damage could be detected as residents turn on their heat for the winter, District Fire Chief James Fortin told NBC10 Boston.
“Once people start turning on heat, we’re afraid that there is going to be damage that people are not aware of and we’re going to have an ongoing carbon monoxide issue,” he said.
Both Fortin and Mitchell advised residents to check their carbon monoxide detectors.
Earthquake damage exposes the potential danger of natural gas heating.
“If you smell gas in your house, after turning the heat on or otherwise, evacuate immediately and call 911,” Mitchell tweeted Sunday.
In 2018, a series of gas explosions in three towns near Boston injured 25 and killed one person.
- Idaho Rattled by Biggest Earthquake in 37 Years - EcoWatch
- Rare Earthquake Rattles New Jersey - EcoWatch
- New Evidence Links Earthquakes to Fracking - EcoWatch
- Volcanoes and Earthquakes: Facts About the Pacific Ring of Fire - EcoWatch