
 568k
568k  233k
233k  41k
41k  Subscribe
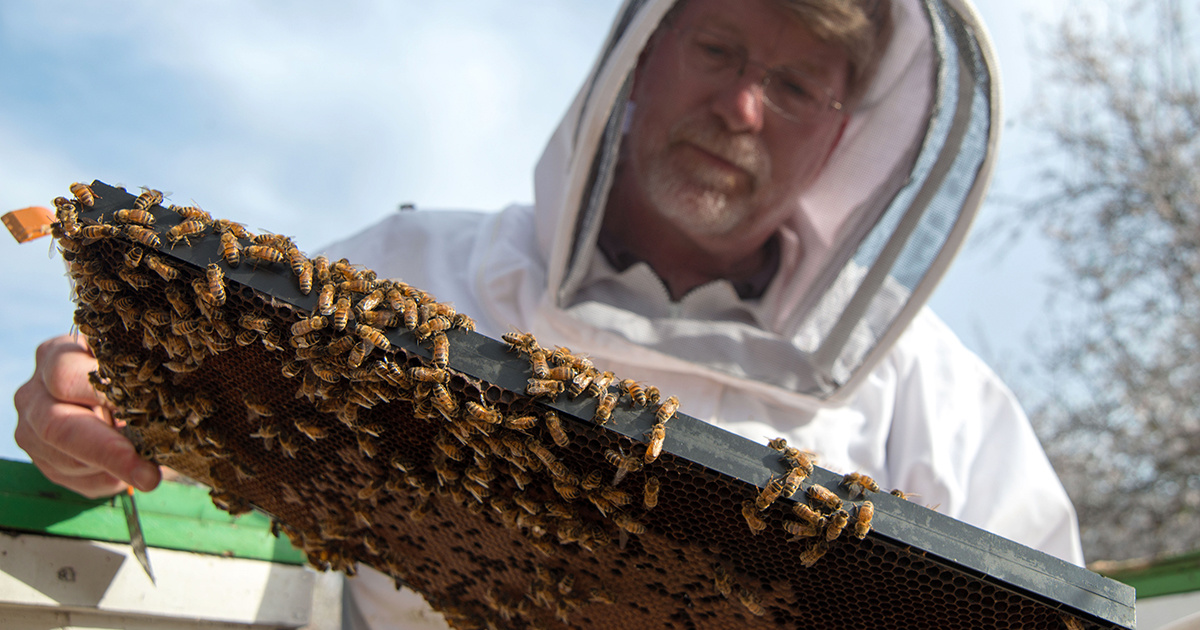
U.S. Department of Agriculture Agricultural Research Service entomologist Dr. Jeff Pettis examines a bee colony in California. Smith Collection / Gado / Getty Images
The U.S. Department of Agriculture’s (USDA) annual honeybee count has fallen victim to budget cuts, CNN reported Saturday.
The suspension of the Honey Bee Colonies report is at least the third bee-related data set to be halted or reduced under the Trump administration, and comes three weeks after Trump’s U.S. Environmental Protection Agency approved the emergency use of bee-killing pesticide sulfoxaflor on 13.9 million acres. It also comes as the population of bees, which help pollinate a third of edible crops, has been declining since 2006.
“This is yet another example of the Trump administration systematically undermining federal research on food safety, farm productivity and the public interest writ large,” Union of Concerned Scientists economist Rebecca Boehm told CNN.
The survey began in 2015 and tracks the number of honeybees in each state by quarter. The most recent report, scheduled to be released in August, will only include data taken from January 2018 to April 2019, the USDA’s National Agricultural Statistics Service said in a statement released July 1.
“The decision to suspend data collection was not made lightly but was necessary given available fiscal and program resources,” the statement said.
A USDA spokesperson told CNN the suspension was “temporary” but did not say how long it might last.
The loss of the data set comes at a crucial time for honeybees. A University of Maryland-led study released in June found that U.S. beekeepers lost 38 percent of their colonies last winter, the greatest winter loss since the university’s research began in 2006, The Washington Post reported.
“We don’t seem to be making particularly great progress to reduce overall losses,” Geoffrey Williams, survey co-author and assistant professor of entomology at Auburn University, told The Washington Post.
Tune in today to hear about the survey and what the @UMDBeeSquad is doing to help! https://t.co/YFjD4CskaF
— University of Maryland Bee Squad (@UMDBeeSquad) June 24, 2019
The survey, organized by the University of Maryland-led Bee Informed Partnership, is the second major colony survey after the USDA count. However, the USDA survey is considered more accurate because it has access to a list of all registered beekeepers in the country, CNN reported.
Mace Vaughan, co-director of the Pollinator Conservation Program at Xerces Society, told CNN the loss of the USDA study meant there was “no redundancy” in the study of bee decline.
“We need some sort of thermometer to be able to determine, at a big scale, are we actually helping to turn around hive loses, to turn around pollinator declines,” Vaughan said. “Understanding what’s going on with honeybees is incredibly important to having a sense of what’s impacting pollinators in general.”
Honeybees have suffered from something called colony collapse disorder since 2006, as The Washington Post explained, when bees began to abandon otherwise healthy colonies.
The Obama administration introduced policies to protect pollinators, but the Trump administration has moved to reverse them, CNN reported. Under Trump, the USDA has also suspended or scaled back two other bee-related surveys: The Cost of Pollination survey, which studied how farmers paid for honeybees, was halted, and the Honey survey has stopped collecting data on honey production from operations with less than five colonies.
- Minnesota Will Pay Residents to Create Bee Friendly Lawns ...
- Trump EPA OKs 'Emergency' Use of Bee-Killing Pesticide on 13.9 ...