
 568k
568k  233k
233k  41k
41k  Subscribe
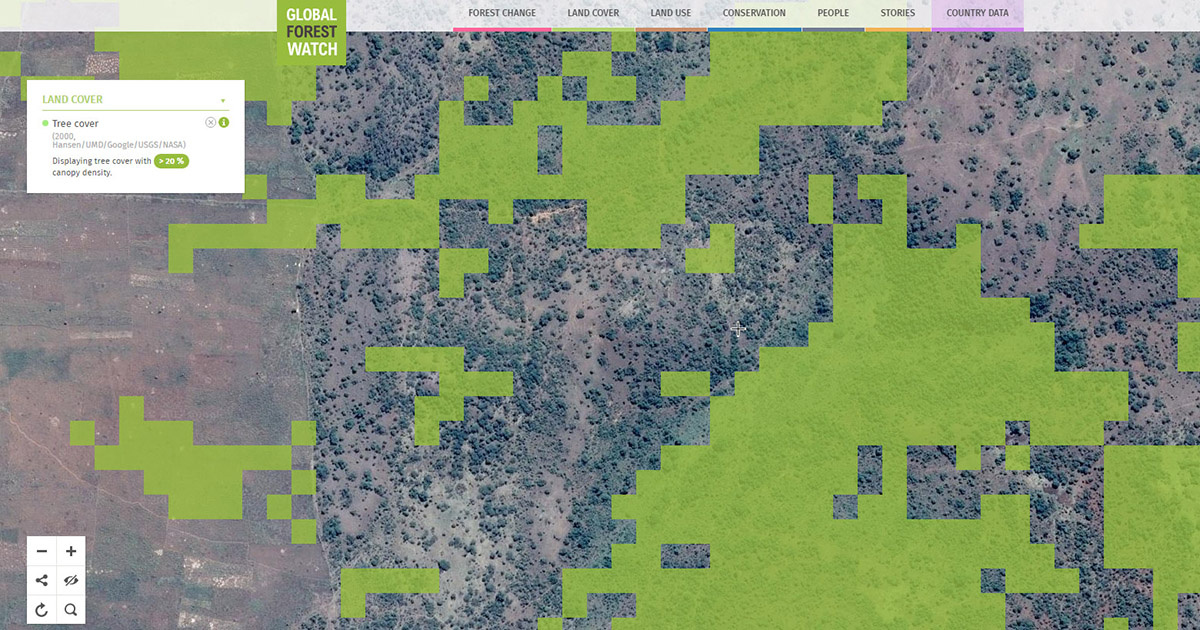
Hansen/UMD/Google/USGS/NASA tree cover data displayed on Global Forest Watch. Green pixels represent tree cover with greater than 20 percent canopy density but do not count trees outside of these pixels. Note, coarse pixels as shown above may be more efficient for rapidly detecting large scales of deforestation, while individual mapping techniques as described below may be more effective for monitoring land restoration and degradation.
By Katie Fletcher, Tesfay Woldemariam and Fred Stolle
No single person could ever hope to count the world’s trees. But a crowd of them just counted the world’s drylands forests—and, in the process, charted forests never before mapped, cumulatively adding up to an area equivalent in size to the Amazon rainforest.
Current technology enables computers to automatically detect forest area through satellite data in order to adequately map most of the world’s forests. But drylands, where trees are fewer and farther apart, stymied these modern methods. To measure the extent of forests in drylands, which make up more than 40 percent of land surface on Earth, researchers from UN Food and Agriculture Organization, World Resources Institute and several universities and organizations had to come up with unconventional techniques. Foremost among these was turning to residents, who contributed their expertise through local map-a-thons.
Technical Challenges, Human Solutions
Traditional remote sensing algorithms detect tree cover in a pixel rather than capturing individual trees in a landscape. That means the method can miss trees in less-dense forests or individual trees in farm fields or grasslands, which is most often the nature of dryland areas.
Google Earth collects satellite data from several satellites with a variety of resolutions and technical capacities. The dryland satellite imagery collection compiled by Google from various providers, including Digital Globe, is of particularly high quality, as desert areas have little cloud cover to obstruct the views. So while difficult for algorithms to detect non-dominant land cover, the human eye has no problem distinguishing trees in the landscapes. Using this advantage, the scientists decided to visually count trees in hundreds of thousands of high-resolution images to determine overall dryland tree cover.
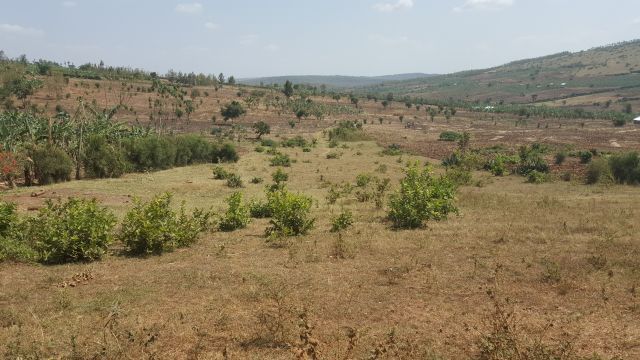 Local knowledge helped researchers ground-truth desert forest tracking. World Resources Institute
Local Map-a-thons Using Collect Earth
Armed with the quality images from Google that allowed researchers to see objects as small as half a meter (about 20 inches) across, the team divided the global dryland images into 12 regions, each with a regional partner to lead the counting assessment. The regional partners in turn recruited local residents with practical knowledge of the landscape to identify content in the sample imagery. These volunteers would come together in participatory mapping workshops, known colloquially as “map-a-thons.”
To lay the groundwork for the local map-a-thon events the team identified both an entry point, usually a university, that could help recruit participants, as well as a facility with the capacity and internet to host the map-a-thon. Once trained, any given analyst could identify 80 to 100 plots per day.
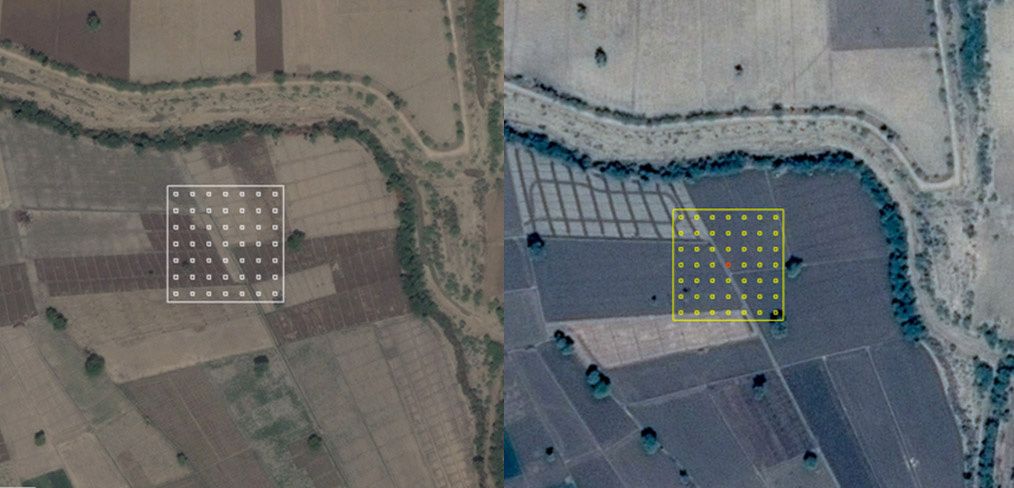
 Example of Collect Earth grid set for data collection.
Quality control was carried out afterwards by comparing the identified land cover with the number of trees counted. For example, if a local participant identified an image as having just three trees but later identified the same image as forest, the researchers knew there was human error and further review was required.
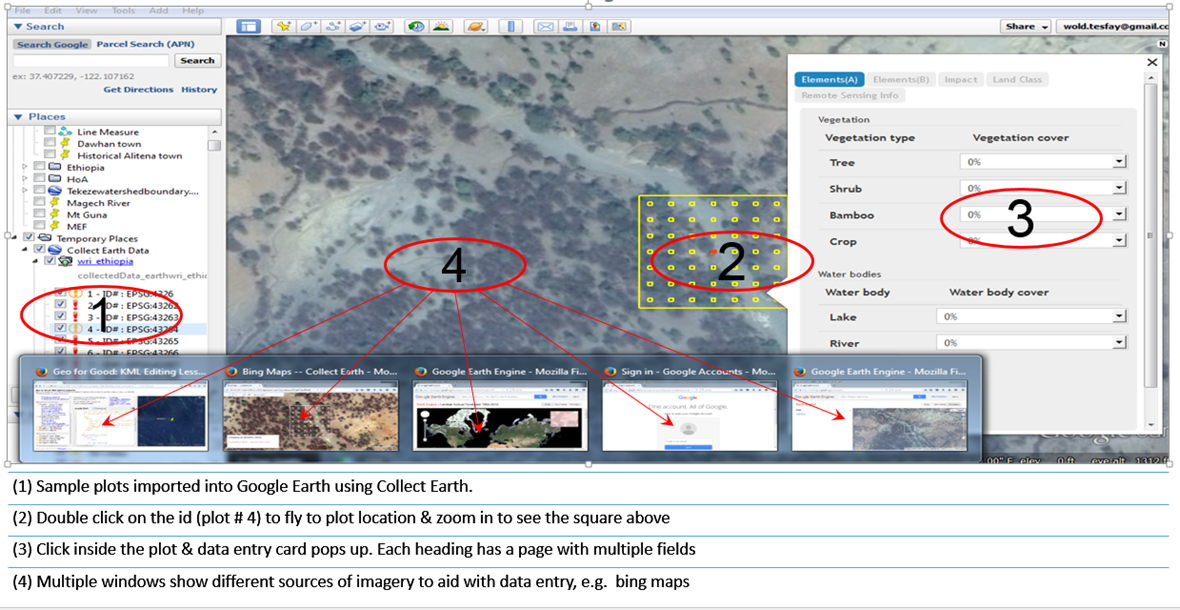
 The Collect Earth tool allows users to navigate between multiple windows and select the best imagery for each particular data point.
These map-a-thons were designed so that people with first-hand knowledge of local landscapes could participate. No knowledge of remote sensing or any technology beyond internet literacy was required. The expertise needed was the understanding of regional landscape and land use. This practical knowledge of the region was critical as the participants were not only able to count individual trees but also identify the type of land use and trees they saw on the Google Earth images.
This research only “discovered” new forest in the sense that Columbus “discovered” the New World. The drylands forest was always there, and the people who live in the area always knew it was there. In fact, they were the only ones who had the background knowledge to identify subtleties like whether an image of a plant in their region was a shrub or actually a young tree, or if what appeared to be a tree was just a perennial plant. A few common perennial crops, including coffee and banana, looked like shrubs in the satellite images, but local participants had no problem identifying them correctly as perennial crops instead of shrubs, a distinction that would have been impossible with satellite imagery analysis alone.
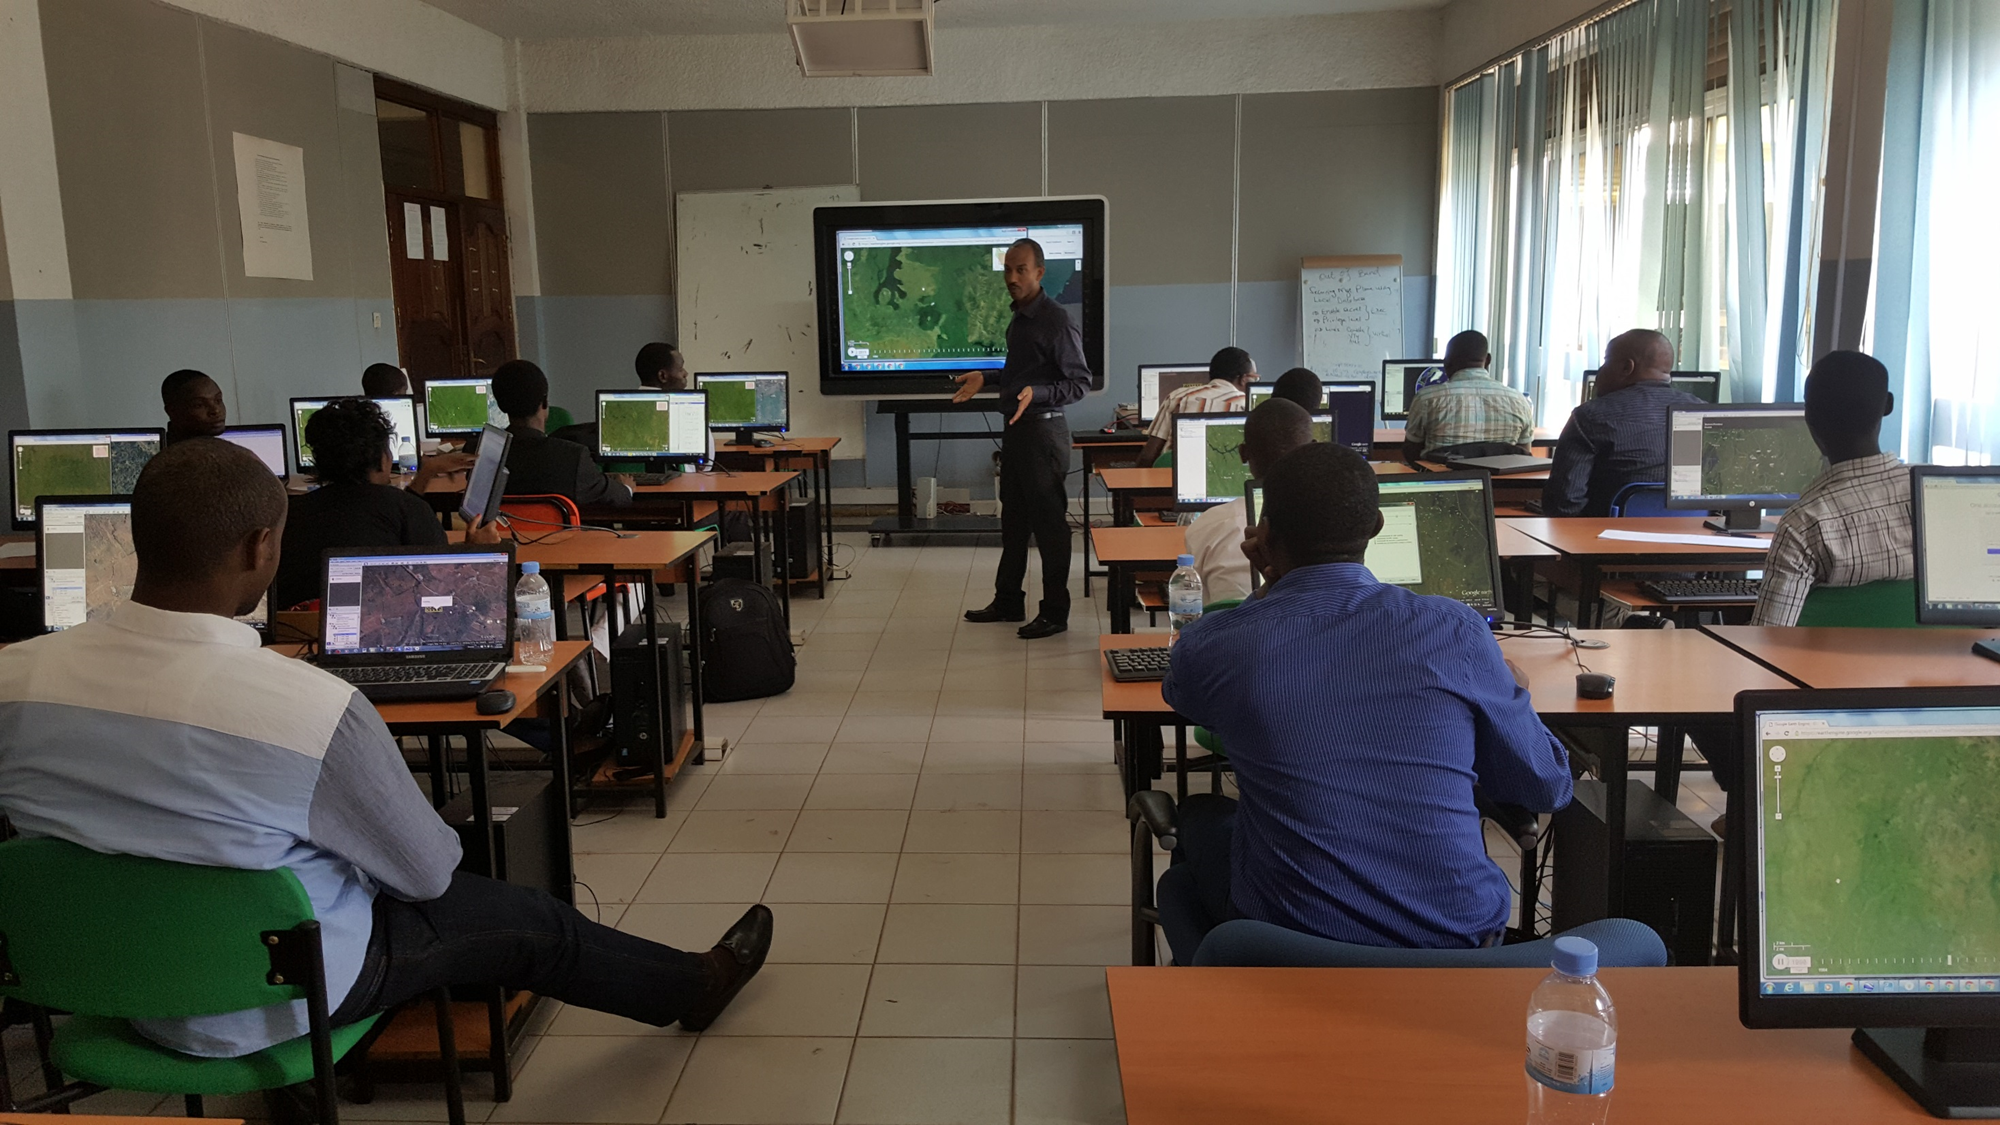 Collect Earth Map-a-thon Event in Gatsibo, Rwanda.
This human identification component, along with the ability to zoom into sub-meter resolution with cheap and available technology, has helped achieve the breakthrough result of forest cover identification 9 percent higher than previously reported.
Local Ownership of the Map and the Land
Utilizing local landscape knowledge not only improved the map quality but also created a sense of ownership within each region. The map-a-thon participants have access to the open source tools and can now use these data and results to better engage around land use changes in their communities. Local experts, including forestry offices, can also use this easily accessible application to continue monitoring in the future.
Global Forest Watch uses medium resolution satellites (30 meters or about 89 feet) and sophisticated algorithms to detect near-real time deforestation in densely forested area. The dryland tree cover maps complement Global Forest Watch by providing the capability to monitor non-dominant tree cover and small-scale, slower-moving events like degradation and restoration. Mapping forest change at this level of detail is critical both for guiding land decisions and enabling government and business actors to demonstrate their pledges are being fulfilled, even over short periods of time.
The data documented by local participants will enable scientists to do many more analyses on both natural and man-made land changes including settlements, erosion features and roads. Mapping the tree cover in drylands is just the beginning.