
 568k
568k  233k
233k  41k
41k  Subscribe
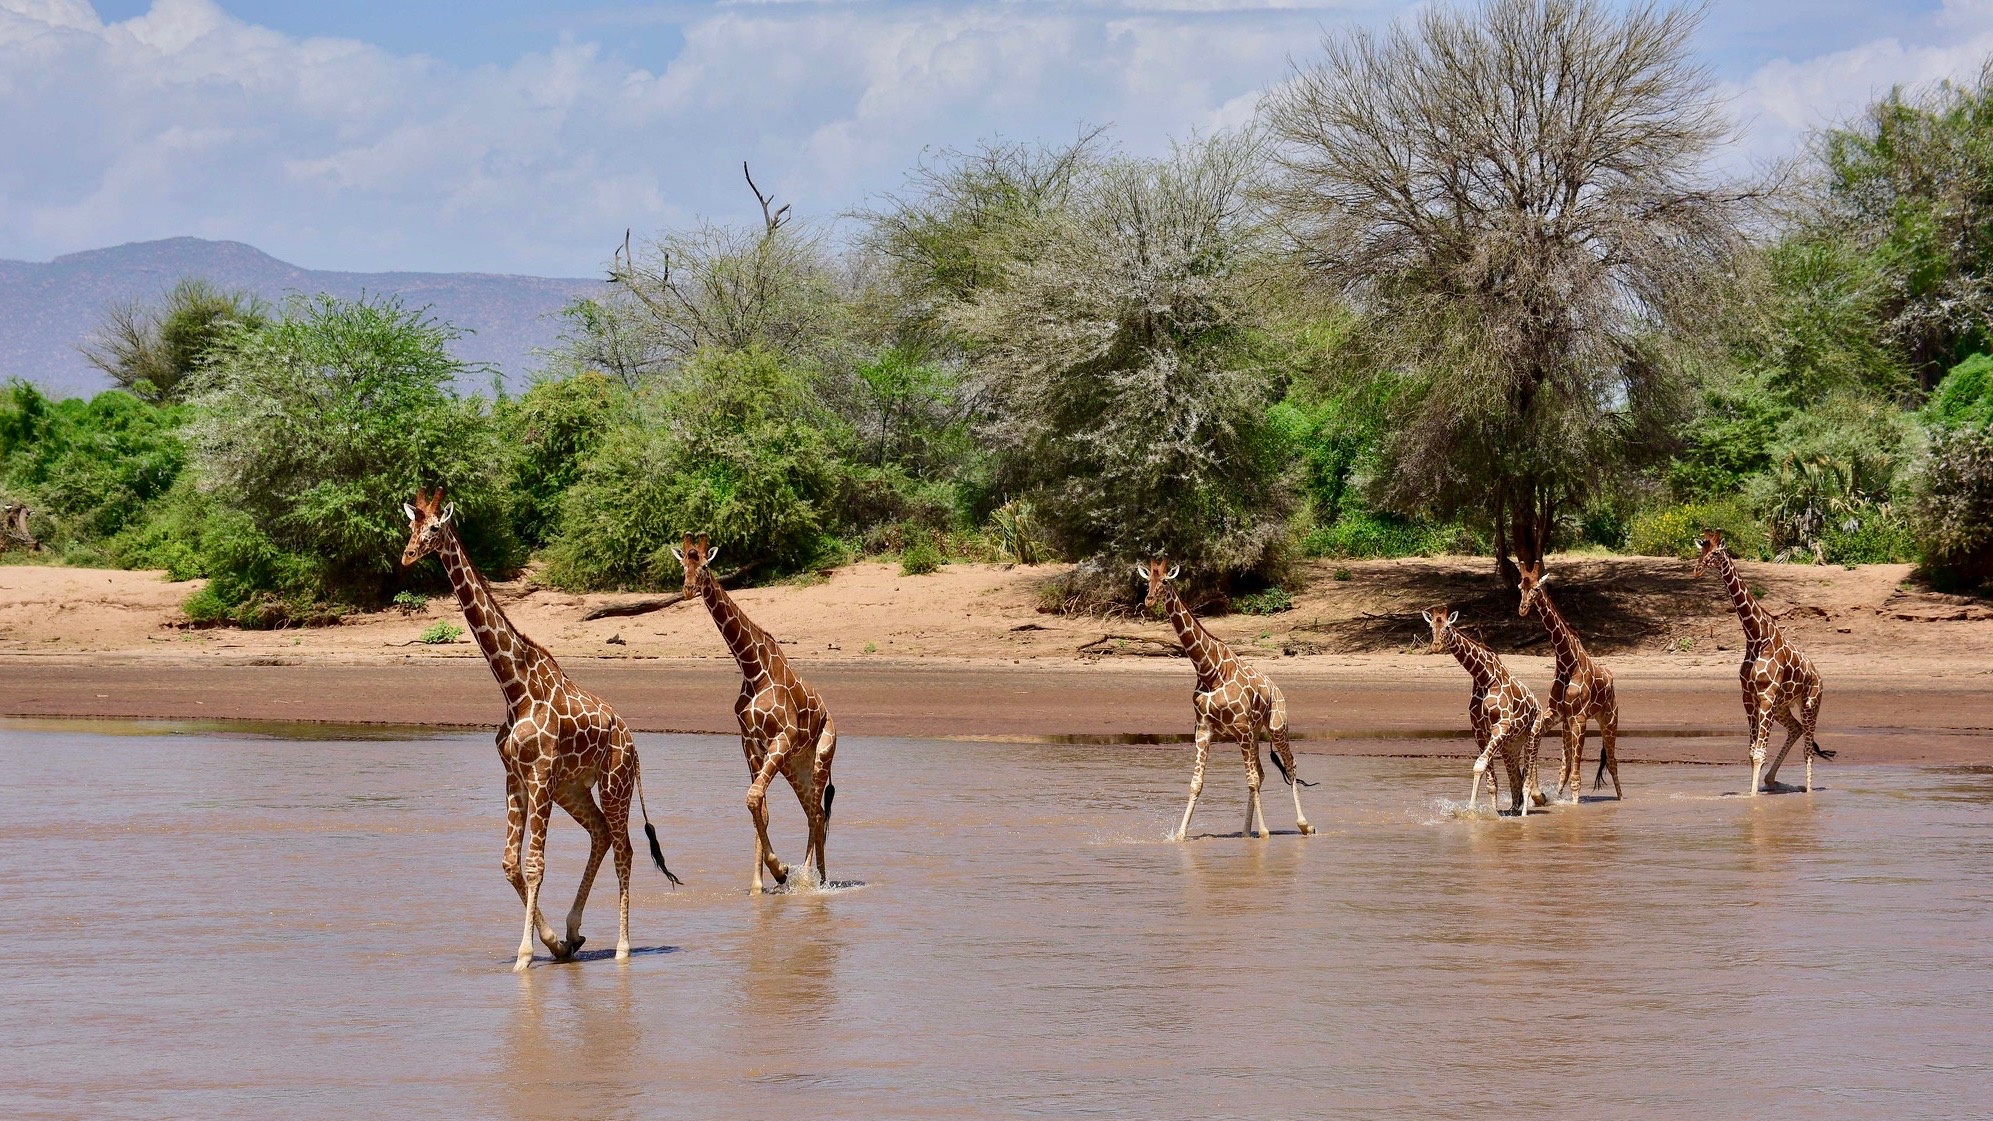
orientalizing / Flickr
The Parties to CITES agreed to list giraffes on Appendix II of the Convention on International Trade in Endangered Species (CITES) today at the World Wildlife Conference or CoP18 in Geneva. Such protections will ensure that all giraffe parts trade were legally acquired and not sourced from the poached giraffes trade and will require countries to make non-detriment findings before allowing giraffe exports. The listing will also enable the collection of international trade data for giraffes that might justify greater protections at both CITES and other venues in the future.
Giraffes are undergoing a “silent extinction,” declining by 40% in the past 30 years. With fewer giraffes than elephants left, they face many threats, including habitat loss, disease, poaching for bushmeat, the international giraffe parts trade, and trophy hunting. Their populations are, for the most part, small, fragmented, and widely scattered. For example, while giraffes used to range throughout much of West Africa, their only remaining population in the region consists of 425 giraffes in Niger. As such, seven of the nine giraffe subspecies have been classified as threatened with extinction by the International Union for the Conservation of Nature.
With six giraffe range states — Central African Republic, Chad, Kenya, Mali, Niger and Senegal — submitting the proposal, and support from the U.S., EU, 32 African nations and leading giraffe scientists, the proposal seemed like a sure winner. However, giraffe protections weren’t guaranteed until late in the game due to a suggestion from Botswana that instead of listing all giraffes, the Parties only list the populations of 13 of the 21 giraffe range states — exempting the populations of Botswana, Eswatini, Namibia, South Africa, Zimbabwe, Mozambique, Tanzania and Zambia. This kind of proposal — referred to as a “split listing” — is frowned upon by CITES as law enforcement can’t tell between illegal and legal species in trade, making enforcement impossible.
Fortunately, the global community rejected this suggestion — and supported the listing of all giraffe species. A great deal of Latin and South American countries, New Zealand, and the U.S. spoke in support of the proposal. In fact, the U.S. Fish and Wildlife Service gave a great statement on how U.S. import data indicates giraffe parts are coming into the U.S. and that we need more data to discern how much this threatens giraffe populations.
While we have lacked international trade data for giraffes since they weren’t previously listed under CITES, U.S. data reveals trade in giraffe parts is soaring with almost 40,000 giraffe parts imported to the U.S. between 2006 and 2015—the equivalent of at least 3,751 giraffes. The most common giraffe parts seen in trade are bone carvings, raw bones, and skins. Further, a 2018 undercover investigation of the U.S. giraffe parts market found a variety of products, including many knives with giraffe bone handles — which have become common in the wake of the ivory ban — and taxidermied trophies.
As a next step, we hope the U.S. — which supported the CITES giraffe proposal — will list giraffes under the Endangered Species Act, which they are currently considering after a lawsuit from NRDC and our partners.
With the Amazon burning and the IPBES Report finding that one million species face extinction, we need all the good news we can get — even if it seems relatively small. Today’s decision is just that.
- Scientists Declare One of Largest Giraffe Subspecies Endangered ...
- Lawsuit Launched to Push Trump Administration to Protect Giraffes ...
- Conservationists Sound Alarm on Plummeting Giraffe Numbers ...
- Female Giraffes With Friends Live Longer, Study Finds - EcoWatch