
 568k
568k  233k
233k  41k
41k  Subscribe
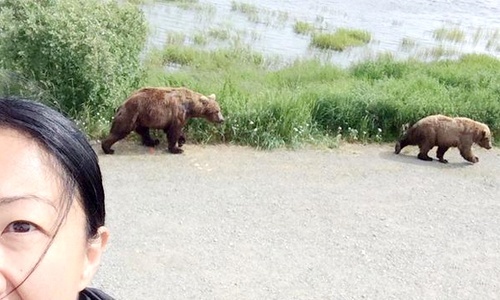
If you’ve ever been to Yellowstone or other parks in the U.S., you’ve seen the signs telling visitors to keep their distance from wild animals. In Yellowstone, park authorities warn visitors to remain within 25 yards of bison and other large animals—and within 100 yards of bears and wolves. And yet, plenty of people just don’t seem to listen.
The #BisonSelfie is really a thing and it’s terrifying. http://t.co/zynqrY7AgQ pic.twitter.com/SWkNrAq2Ip
— KPAX Missoula News (@kpaxnews) August 19, 2015
In July, a woman and her daughter attempted to snap a selfie about six yards away from a bison. The bison charged, lifting the woman up and tossing her with its head. Fortunately, she only sustained minor injuries. The woman was “the fifth person injured after approaching a bison in Yellowstone so far this season—and the third whose dangerous encounter resulted from photo-taking,” reports CNN.
Though Yellowstone and other parks have come to feel like giant zoos with many lamenting the “Disneyfication” of our national parks, many visitors seem to have forgotten that wild animals are unpredictable and potentially dangerous.
“The family said they read the warnings in both the park literature and the signage, but saw other people close to the bison, so they thought it would be OK,” Park Ranger Colleen Rawlings said to CNN about the attack in July. “People need to recognize that Yellowstone wildlife is wild, even though they seem docile. This woman was lucky that her injuries were not more severe.”
Another example of some brazen stupidity is in this YouTube video:

If you’re thinking these are isolated incidents, think again. Waterton Canyon, a recreation and hiking area in Denver, Colorado, announced that it would close to the public because too many hikers “are trying to take selfies with bears,” according to The Guardian. Initially, the park announced that it would close on Aug. 28 “due to increased bear activity in the canyon.” But a Denver Water blogpost on Sept. 4 revealed that the real reason is because “hundreds, if not thousands of visitors a day are looking for that perfect wildlife shot. That’s asking for trouble.”
“We’ve actually seen people using selfie sticks to try and get as close to the bears as possible, sometimes within 10 feet of wild bears,” said Brandon Ransom, Denver Water’s manager of recreation. “The current situation is not conducive for the safety of our visitors or the well-being of the wildlife.”
Lake Tahoe park officials have warned hikers to stop taking selfies with bears, as well:
[youtube https://www.youtube.com/watch?v=K8Y23xpc2Zk
expand=1]
A simple search on Twitter and Instagram reveals how common it is (it’s even got its own hashtag):
My first #bearselfie of 2015 & hopefully not last! #alaska #bristolbay #katmai pic.twitter.com/ty2BoVzPG3
— Louisa Chu 朱功蕾 (@louisachu) July 2, 2015
Great trip to Black Bear Island #bearselfie #BeAlive pic.twitter.com/oYSoHi4wF3
— Chris Keefer (@ckeefer18) May 25, 2015
Love me a good #selfie #RT ? #bearselfie #smokey #chipinque pic.twitter.com/6lUPLtgNrc
— Aaron Berkowitz (@BerkowitzAaron) April 7, 2015
"@alramirezUSA #naturalselection #nature will sift out those as dumb as these pl http://t.co/G1yGOOsedz #bearselfie pic.twitter.com/hobZwSRlS0""
— DIANAETERNO111111111 (@Myownvoice79) November 17, 2014
[instagram https://instagram.com/p/7kxiDxENLo expand=1]
[instagram https://instagram.com/p/pk1Fw6uVAG expand=1]
[instagram https://instagram.com/p/qpdEhoNPz_ expand=1]
[instagram https://instagram.com/p/rXdR_rMSJ4
National Geographic just published this week: How to Not Get Attacked by a Bear. Bears are making a comeback across the country “thanks to regulated hunting and increased habitat,” says National Geographic. And more and more humans are living in bear territory. So bear encounters are increasing dramatically.
Just last month, a man was killed by a bear in Yellowstone. Bear attacks are still quite rare—and fatalities even rarer. Still, it’s important to know what to do when you encounter a bear (hint: whipping out your camera is not step one). I highly recommend reading the National Geographic article, especially if you plan to be hiking in an area that bears frequent. And for God’s sake, please stop getting so close to bears just for the sake of some likes on Facebook or Instagram.
YOU MIGHT ALSO LIKE
Massive Earthquake Triggers Tsunami, Claims Lives in Chile
True Blood and 30 Rock Actors Sail to Greenland to Film Funny or Die Series to ‘Save the Arctic’
Arctic Warming Produces Mosquito Swarms Large Enough to Kill Baby Caribou