
 568k
568k  233k
233k  41k
41k  Subscribe
By Bob Henson
Between a record-strong El Niño and catastrophic floods, fires and drought, 2016 was a memorable year for weather and climate in North America as well as globally. What can we expect as we roll into 2017? A precise weather forecast is asking too much, but there is already a lot we can say about some key factors. Here are six developments to watch for in 2017. They’re presented in rough order of increasing confidence, followed by details on each prediction.
1. Better Odds of El Niño Than La Niña, but a Neutral Pacific Still Favored
The biggest single driver of year-to-year atmospheric variations around the globe is the El Niño–Southern Oscillation (ENSO), including El Niño and its counterpart, La Niña. A year ago, it was virtually certain that the record-strong El Niño of 2015-16 would continue through at least the first few months of 2016, as it indeed did. This time around, the ENSO signal is far less clear-cut. Sea surface temperatures (SSTs) in the benchmark Niño 3.4 region of the eastern tropical Pacific have been inconclusive in recent months, hovering close to the La Niña threshold (at least -0.5 C below the seasonal average) since late July.
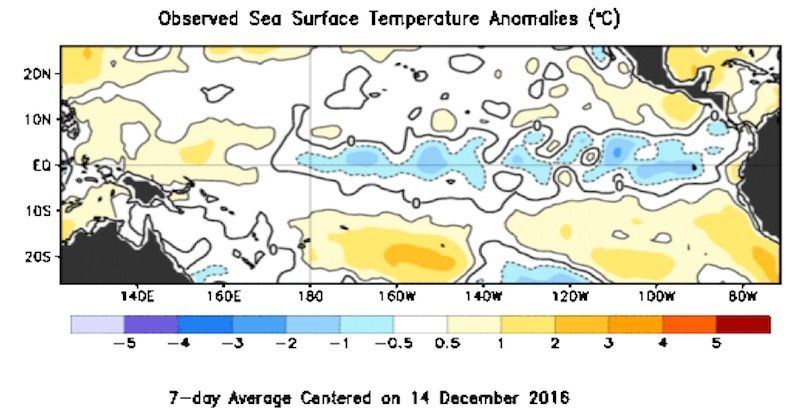 Figure 1. Departures from average sea surface temperature for this time of year as of mid-December show a diffuse, borderline La Niña signal across the central and eastern tropical Pacific. NOAA Climate Prediction Center
It’s now become less likely that the ocean and atmosphere will commit to a well-defined La Niña event for early 2017. There’s almost no telling what will happen later in the year, on the other side of the infamous “spring predictability barrier” that often separates one El Niño or La Niña event from another. One clue we do have is the unusual persistence this year of a belt of warmer-than-average SSTs from the central tropical Pacific to the west coast of North America. This warm phase of what’s called the Pacific Meridional Mode may herald a new El Niño event in 2017-18, as niftily explained by Dan Vimont (University of Wisconsin Center for Climatic Research) in a recent climate.gov post.
In their joint probabilistic outlook issued in early December, NOAA’s Climate Prediction Center (CPC) and the International Research Institute for Climate and Society (IRI) called for decreasing odds of La Niña over the next few months, dropping to just 18 percent by late spring. Neutral conditions are deemed most likely by CPC/IRI, with 65 percent odds by spring and 53 percent by summer. And the odds of El Niño are expected to steadily rise throughout the first half of 2017, reaching 29 percent by summer. Strong El Niño events like the one we just had are usually followed by a significant La Niña event. If the atmosphere instead ends up cueing El Niño for 2017-18, it would reinforce the notion that we’ve entered a positive phase of the Pacific Decadal Oscillation—a sign that we might expect more El Niño than La Niña events for as long as a decade or two.
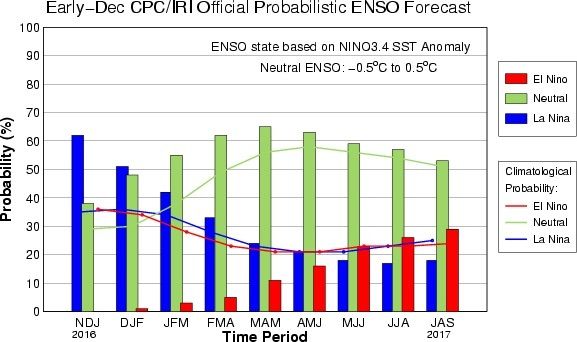 Figure 2. Probabilities of El Niño (red), La Niña (blue) and neutral conditions (green), for each overlapping three-month period from November-January 2016-17 (left) to July-September 2017 (right).NOAA / IRI
2. Wide Range of Possibilities for Atlantic Hurricane Action
The well-predicted demise of the 2015-16 El Niño boosted confidence in 2016’s largely successful seasonal hurricane outlooks for the Atlantic, where wind shear was down from 2015 and sea-surface temperatures saw a spike atop their long-term warming trend. (See our roundup post from Dec. 27 on global tropical cyclones in 2016 and their connections to climate change.) Because ENSO is one of the biggest shapers of Atlantic hurricane seasons, our current uncertainty about next year’s ENSO state means we can’t say much yet about whether the 2017 Atlantic tropical season will be hectic, sedate or somewhere in between.
Forecasters at Colorado State University no longer issue formal seasonal hurricane outlooks as early as December, but CSU’s Dr. Phil Klotzbach laid out his thoughts for us last week in a qualitative discussion. Along with monitoring ENSO, Klotzbach also keeps close tabs on the Atlantic Multidecadal Oscillation and Atlantic thermohaline circulation, which are cyclic natural variations in SST, surface air pressure, and oceanic flow across the North Atlantic. When the AMO is positive (warm) and the THC is strong, the Atlantic pumps out more hurricanes over periods that can range from 25 to 35 years. At other times, unusually cold waters prevail in the far North Atlantic, typically a sign of a slowdown of the THC and a ramp-down in Atlantic hurricane action.
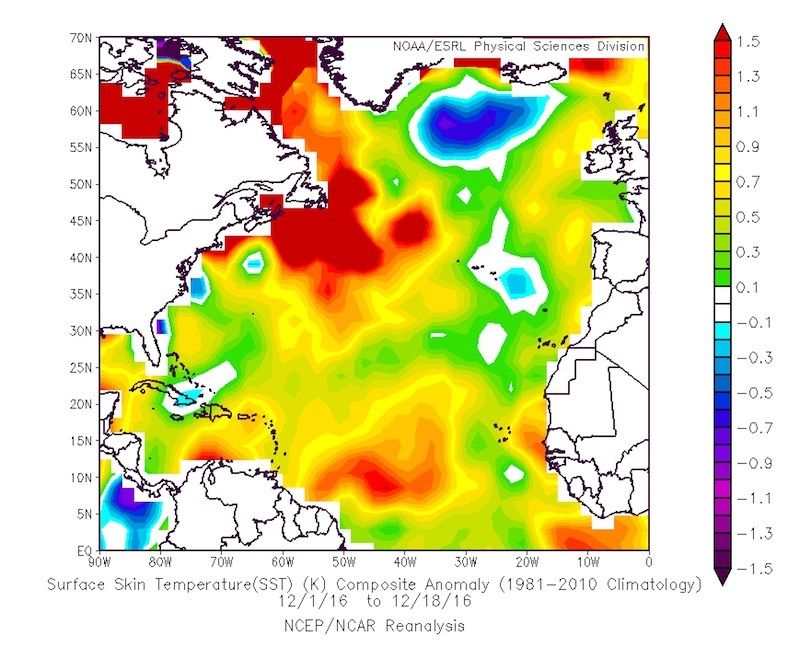 Figure 3. Warmer-than-average waters covered most of the Atlantic Ocean from the equator northward for the period Dec. 1-18. NOAA / ESRL Physical Sciences Division, courtesy Phil Klotzbach
With cold waters widespread across the far north Atlantic in 2014 and 2015, Klotzbach hypothesized in a 2015 Science article that the active Atlantic period that began in 1995 may have already drawn to a close. Now he’s not so sure. “I was generally thinking we had moved into a cold AMO, but we haven’t yet seen the re-emergence of the cold anomalies in the far North Atlantic like we have the past couple of winters (at least not yet!),” Klotzbach told me in an email. For this analysis, Klotzbach typically uses SSTs across a box roughly bounded by 50 N-60 N latitude and 10 W-50 W longitude. Figure 3 shows that only part of this area currently has below-average SSTs. “We’re just now moving into the height of winter, though, so we may still see some reemergence and anomalous cooling in the far North Atlantic this winter,” said Klotzbach. “I decided to hedge with the outlook so far, and hopefully we’ll have a better idea of what is coming up by the time the April forecast rolls around.” Here are the five possibilities (with odds) put forth by Klotzbach in his December update:
40 percent chance: AMO/THC is above average and no El Niño occurs (resulting in a seasonal average Accumulated Cyclone Energy (ACE) activity of ~ 130).
20 percent chance: AMO/THC becomes very strong in 2017 and no El Niño occurs (ACE ~ 170).
20 percent chance: AMO/THC is below average and no El Niño occurs (ACE ~ 80).
10 percent chance: AMO/THC is above average and El Niño occurs (ACE ~ 80).
10 percent chance: AMO/THC is below average and El Niño develops (ACE ~ 50).
3. More Tornadoes and Tornado Deaths in 2017 Than 2016? Probably So
It’s been a blessedly quiet year for U.S. tornadoes, climatologically speaking. According to Patrick Marsh (NOAA Storm Prediction Center), the year 2016 delivered a preliminary total of 1060 tornado reports through Dec. 28, with few or none expected through the rest of the year. This may sound like a very high total, but the number of final tornado reports typically drops from the preliminary total by about 15 percent after duplicate reports have been weeded out. The annual number drops even further relative to prior years when it’s adjusted for “inflation” against earlier decades, when fewer people were watching and reporting every twister. Using a linear trend adjustment, Marsh estimates that the final, inflation-adjusted tornado total for 2016 will be around 888, which would be the lowest for any year going back to at least 1954 assuming that the database is normalized (inflation-adjusted) through 2015. “Four of the last five years—2016, 2014, 2013 and 2012—have been the quietest years on record when report inflation is accounted for,” said Marsh.
This year did produce a few dramatic outbreaks during peak tornado season, but these played out mostly in open country, where few structures were damaged and few people were hurt. The deadliest events of 2016 were “off-season”: seven people died in a Southeast and East Coast tornado outbreak on Feb. 23-24–the nation’s second-largest February outbreak on record–and five deaths occurred across the South during an overnight outbreak on Nov. 29-30.
All told, tornadoes have killed only 17 people in the U.S. in 2016, well below the average toll of 46 per year over the three prior years. Assuming we make it to Dec. 31 without any additional tornado deaths, which looks almost certain, we’ll have been graced with the least-deadly U.S. year for twisters since 1986, when only 15 people were killed. In data going back to 1875 provided by Harold Brooks (National Severe Storms Laboratory), the only other year with fewer than 20 deaths was 1910, with just 12 fatalities.
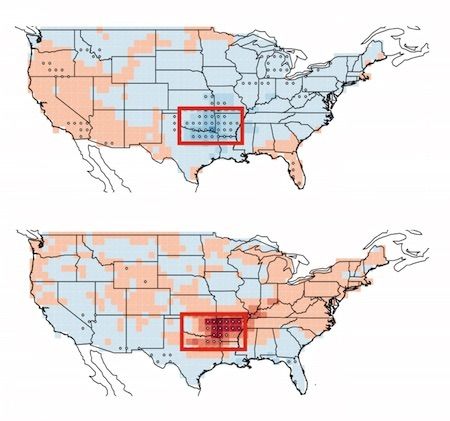 Figure 5. During El Niño events (top), the frequency of U.S. tornadoes typically drops. When a La Niña phase prevails (bottom), tornado frequency goes up (indicated by red areas). The effect is strongest in the boxed area.Nature Geoscience 2015, courtesy IRI
The strong El Niño of 2015-16 likely helped tamp down tornado activity this year, at least in the heart of Tornado Alley. Researchers at IRI/Columbia University have shown that the most active spring seasons for tornado and hail over the central U.S., especially the Southern Plains, are linked to strong La Niña events, while the very quietest seasons are related to strong El Niño events. In January 2015, the researchers, led by John Allen (now at Central Michigan University), called for better-than-even odds (54 percent) of a below-average number of tornadoes this year, as opposed to the 33/33/33 percent split (below, above, and near average) one would otherwise expect. (See more details at this conference presentation).
As with Atlantic hurricanes, even a mostly quiet season can still produce deadly mayhem if one destructive event, such as a major landfalling hurricane or a family of violent tornadoes, happens to hit the wrong place at the wrong time. “It’s an ongoing challenge to think about how to convey this information,” Allen told me. “I think it’s also worth noting that we still don’t have a lot of other climate signals for improving our forecasts when we don’t have ENSO-driven predictability.” It’s thus hard to tell how tornado counts will evolve in 2017, since the ENSO signal is so weak. However, given the very low activity this year, there’s a good chance that we will see more twisters prowling the nation in 2017 than we did in 2016.
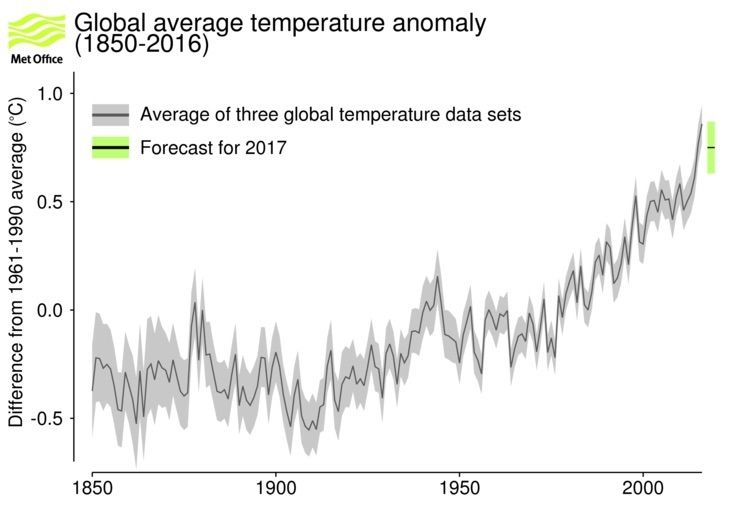 Figure 6. The U.K. Met Office predicts that the 2017 global temperature (forecast range shown in green at right) will likely fall below the record value expected to be set in 2016. The dark line shows global temperature since 1850. UK Met Office
4. A Very Warm Year Globally, but Likely Short of a Record
Barring a major, sun-blocking volcanic eruption, we can expect 2017 to continue the long-term warming trend of the last few decades attributed to human-produced greenhouse gases. However, 2017 is unlikely to continue the string of global record highs set in 2014, 2015, and (virtually certainly) 2016. The record-strong El Niño of 2015-16, which sent vast amounts of heat from ocean to atmosphere, played a key role in pushing temperatures just enough above the long-term warming trend to set new global highs. Now that this major El Niño is gone, it’s no surprise that global atmospheric heat is already subsiding a bit relative to seasonal norms—though it would be a huge mistake to interpret this totally expected dip as any sign that longer-term warming has gone away.
On Dec. 20, the UK Met Office released its official outlook for 2017 (see Figure 6). The agency projects that global temperature will end up between 0.63 and 0.87 C (1.45 – 1.89 F) above the 1961-1990 average of 14.0 C (57.2 F). “This forecast, which uses the new Met Office supercomputer, adds weight to our earlier prediction that 2017 will be very warm globally but is unlikely to exceed 2015 and 2016: the two warmest years on record since 1850,” said Adam Scaife, head of long-range prediction at the Met Office. According to research fellow Chris Folland: “2016 was well forecast as the methods used detected the warming influence of the strong El Niño. However, last year’s El Niño only accounts for around 0.2 C of the global mean temperature rise for 2016, when compared with the long-term average between 1961 and 1990. Increasing greenhouse gases are the main cause of warming since pre-industrial times.”
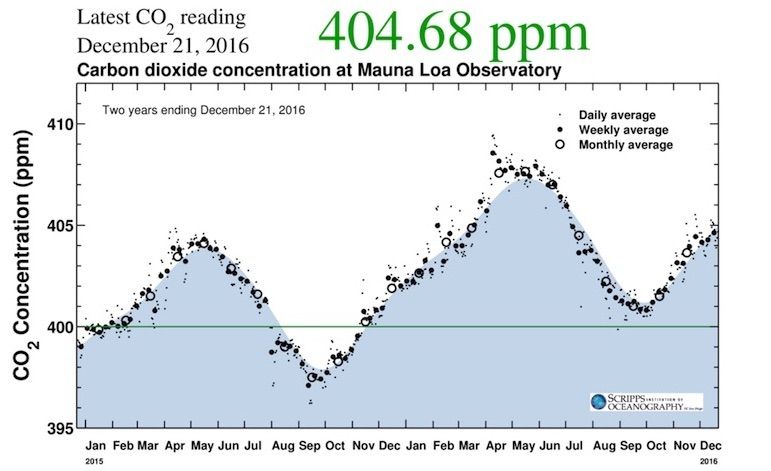 Figure 7. Carbon dioxide concentration (parts per million in the atmosphere) as measured atop Mauna Loa, Hawaii, in 2015 and 2016. Along with daily, weekly, and monthly variability, there is a reliable yearly cycle associated with the growth and decay of vegetation in the Northern Hemisphere.
5. Another New Peak in Global Carbon Dioxide
Sadly, our highest-confidence forecast for the atmosphere is that carbon dioxide concentrations will continue their relentless upward march. The burning of fossil fuels continues to release more than 35 billion metric tons of CO2, an invisible greenhouse gas, every year. (That’s about 10,300 pounds for every person on Earth). Just over half of that total is absorbed by plants, soil and the sea each year. The rest stays in the atmosphere, much of it destined to stay there for many hundreds and even thousands of years.
CO2 values measured atop Mauna Loa Observatory in Hawaii are once again rising toward the usual spring peak after hitting their annual low in late September of around 401 parts per million. Because most of Earth’s plant life is north of the equator, atmospheric CO2 drops with the growth of CO2-absorbing vegetation in late northern spring and summer, and it increases again each winter and spring as vegetation dies off. We can expect daily and weekly CO2 values in spring 2017 to soar above 410 ppm for the first time in human history, and it’s even possible the monthly average will hit that mark as well.
The final weekly value below 400 ppm that we’ll see in our lives is virtually certain to be the 399.86 ppm value recorded in late August 2015 during the approach of Hurricane Madeline. As that hurricane approached Hawaii from the east, its circulation is believed to have imported slightly lower-CO2 air from north of Hawaii.
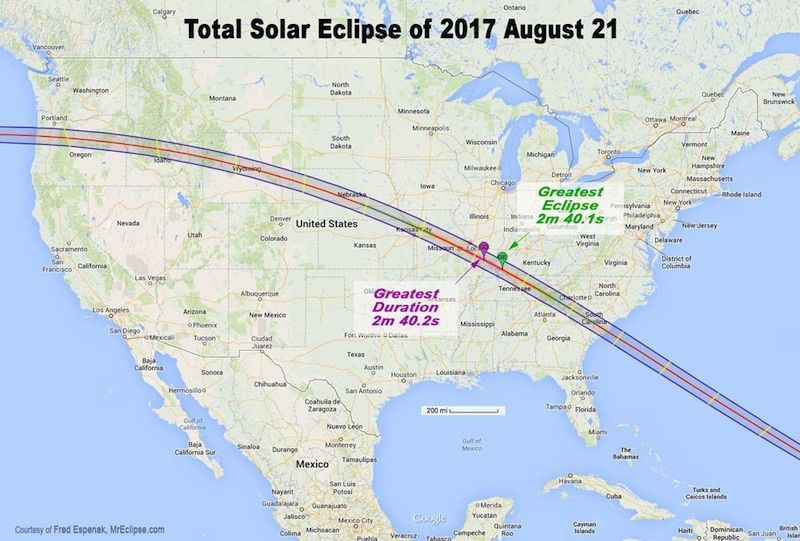 Figure 8. A total solar eclipse will occur along the belt shown here on August 21, 2017. All of North America and parts of South America will experience at least a partial solar eclipse.Fred Espenak (NASA / GSFC) / MrEclipse.com
6. Slam-Dunk Forecast: A Spectacular Total Eclipse in August
We can say with rock-solid confidence that a large swath of the U.S. will be treated to one of the most widely viewable total solar eclipses in U.S. history (if the weather cooperates!) on Aug. 21. The band of totality—the region where the sun will be completely obscured by the moon for as long as 2 minutes and 40 seconds—will extend from northern Oregon across the central Plains and mid-South to South Carolina (see Figure 8). Millions of Americans will be within an hour or two’s drive of the totality band, and untold numbers of people from across the world are heading to the States for the big show. The timing of totality will range from about 10 a.m. PDT on the West Coast to around 2:45 p.m. EDT on the East Coast. This means that the mid-August sun will be quite high in the sky for the eclipse, enhancing the potential drama.
NASA has a plethora of great material on the upcoming eclipse, including an excellent “Eclipse 101” page with crucial safety tips (for example, never look at an uneclipsed or partially eclipsed sun without specially designed glasses that meet international standards for eclipse viewing). Obviously, there’s no telling what the weather will be doing on Aug. 21, but the perfectly named Eclipseophile website has state-by-state breakdowns of where climatology leans toward the best views. As one might expect, the highest odds of cloud-free skies and dry air are toward the western U.S.
Reposted with permission from our media associate Weather Underground.