Why California Gets to Write Its Own Auto Emissions Standards: 5 Questions Answered

By Nicholas Bryner and Meredith Hankins
Editor's note: On April 2, U.S. Environmental Protection Agency (EPA) Administrator Scott Pruitt announced that the Trump administration plans to revise tailpipe emissions standards negotiated by the Obama administration for motor vehicles built between 2022 and 2025, saying the standards were set "too high." Pruitt also said the EPA was re-examining California's historic ability to adopt standards that are more ambitious than the federal government's. Legal scholars Nicholas Bryner and Meredith Hankins explain why California has this authority—and what may happen if the EPA tries to curb it.
Where does California get this special authority?
The Clean Air Act empowers the EPA to regulate air pollution from motor vehicles. To promote uniformity, the law generally bars states from regulating car emissions.
But when the Clean Air Act was passed, California was already developing innovative laws and standards to address its unique air pollution problems. So Congress carved out an exemption. As long as California's standards protect public health and welfare at least as strictly as federal law, and are necessary "to meet compelling and extraordinary conditions," the law requires the EPA to grant California a waiver so it can continue to apply its own regulations. California has received numerous waivers as it has worked to reduce vehicle emissions by enacting ever more stringent standards since the 1960s.
Other states can't set their own standards, but they can opt to follow California's motor vehicle emission regulations. Currently, 12 states and the District of Columbia have adopted California's standards.
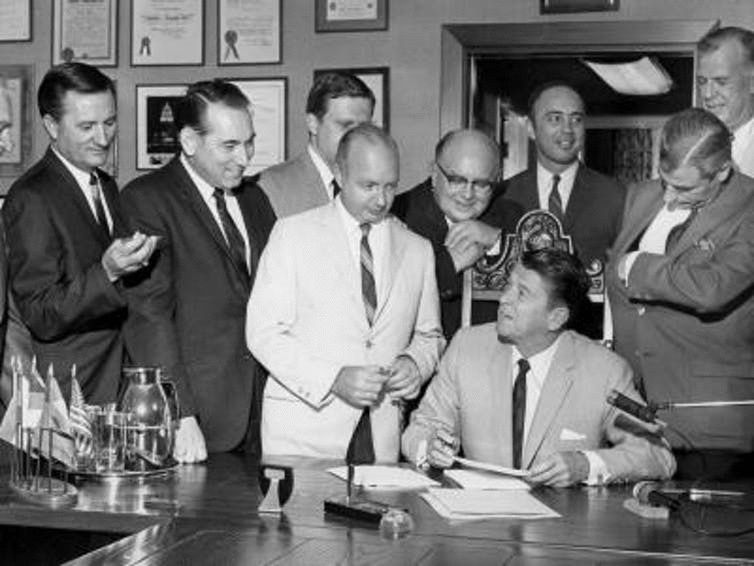
Gov. Ronald Reagan signs legislation establishing the California Air Resources Board to address the state's air pollution, Aug. 30, 1967. CA ARB
What are the "compelling and extraordinary conditions" that California's regulations are designed to address?
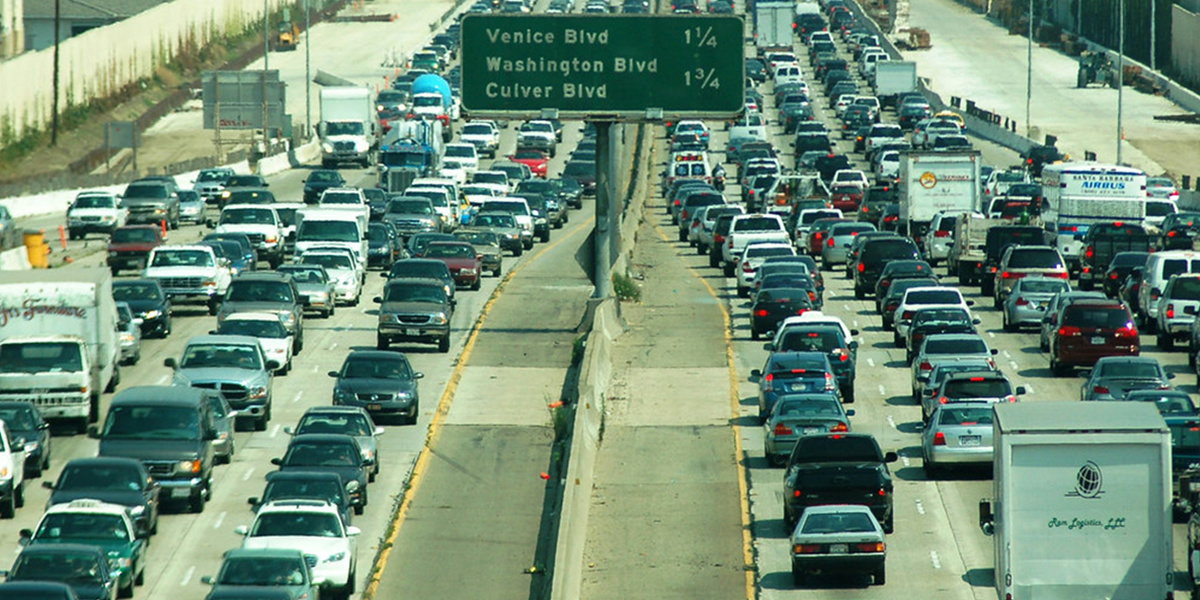
In the 1950s scientists recognized that the unique combination of enclosed topography, a rapidly growing population and a warm climate in the Los Angeles air basin was a recipe for dangerous smog. Dutch chemist Arie Jan Haagen-Smit discovered in 1952 that worsening Los Angeles smog episodes were caused by photochemical reactions between California's sunshine and nitrogen oxides and unburned hydrocarbons in motor vehicle exhaust.
California's Motor Vehicle Pollution Control Board issued regulations mandating use of the nation's first vehicle emissions control technology in 1961, and developed the nation's first vehicle emissions standards in 1966. Two years later the EPA adopted standards identical to California's for model year 1968 cars. UCLA Law scholar Ann Carlson calls this pattern, in which California innovates and federal regulators piggyback on the state's demonstrated success, "iterative federalism." This process has continued for decades.
California has set ambitious goals for slowing climate change. Is that part of this dispute with the EPA?
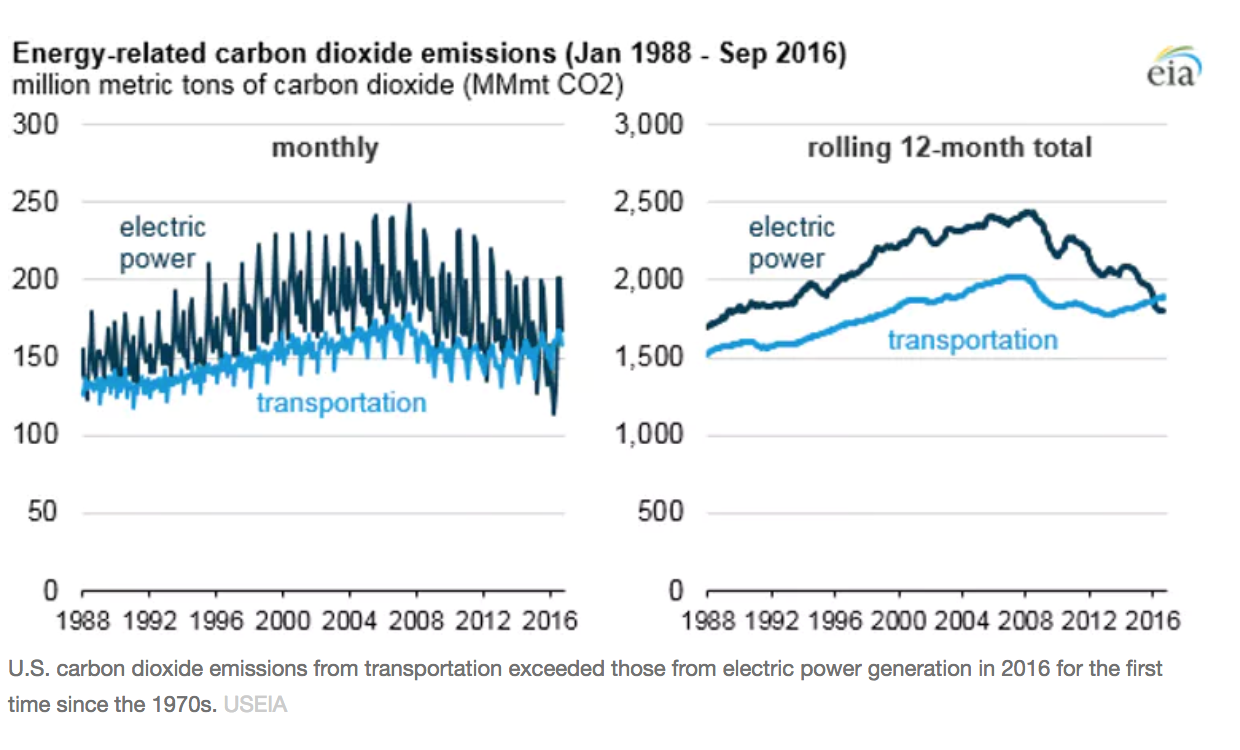
Yes. Transportation is now the largest source of greenhouse gas (GHG) emissions in the U.S. The tailpipe standards that the Obama EPA put in place were designed to limit GHG emissions from cars by improving average fuel efficiency.
These standards were developed jointly by the EPA, the U.S. Department of Transportation (DOT) and California, which have overlapping legal authority to regulate cars. EPA and California have the responsibility to control motor vehicle emissions of air pollutants, including GHGs. DOT is in charge of regulating fuel economy.
Congress began regulating fuel economy in response to the oil crisis in the 1970s. DOT sets the Corporate Average Fuel Economy (CAFE) standard that each auto manufacturer must meet. Under this program, average fuel economy in the U.S. improved in the late 1970s but stagnated from the 1980s to the early 2000s as customers shifted to purchasing larger vehicles, including SUVs, minivans and trucks.
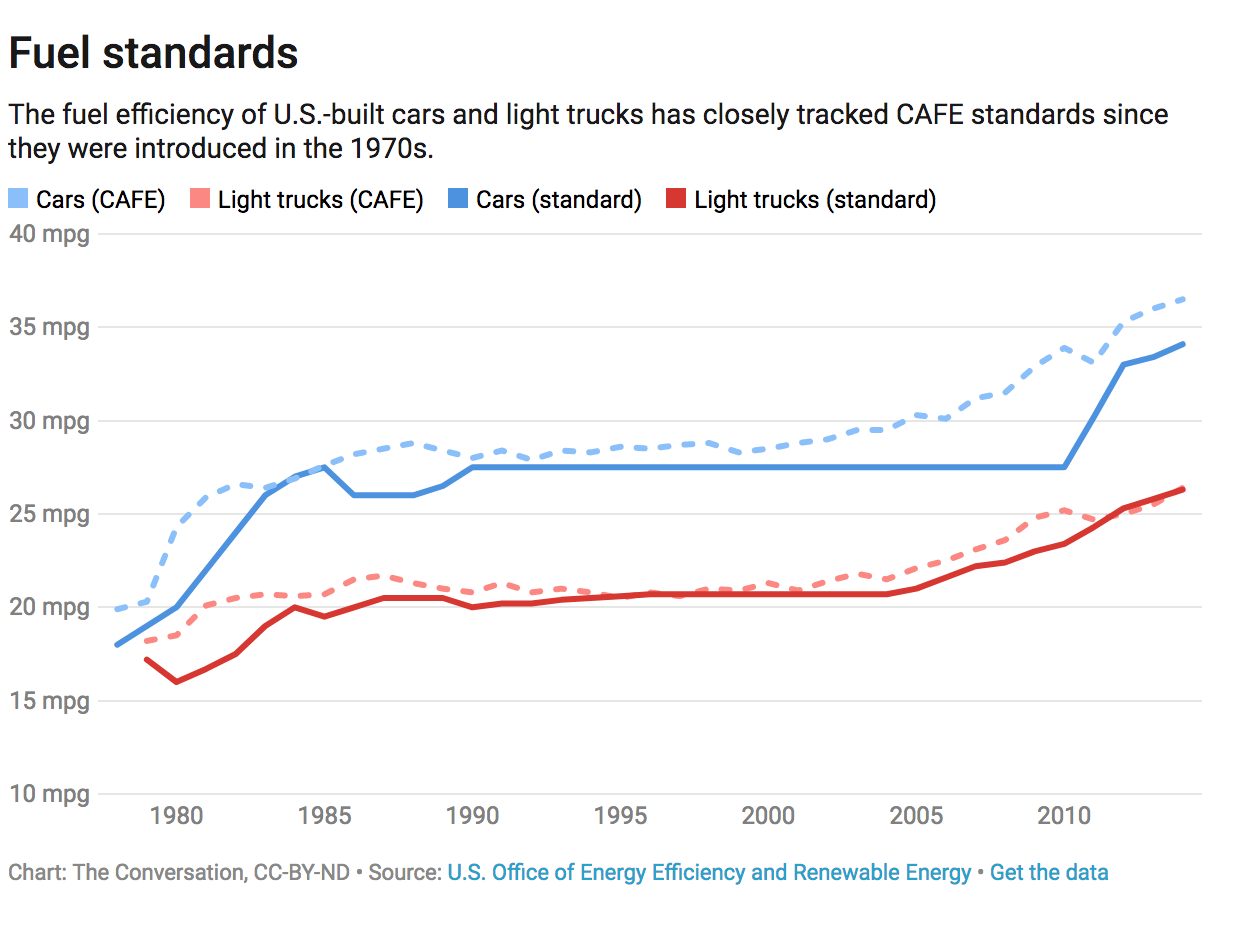
In 2007 Congress responded with a new law that required DOT to set a standard of at least 35 miles per gallon by 2020, and the "maximum feasible average fuel economy" after that. That same year, the Supreme Court ruled that the Clean Air Act authorized the EPA to regulate GHG emissions from cars.
The Obama administration's tailpipe standard brought these overlapping mandates together. EPA's regulation sets how much carbon dioxide can be emitted per mile, which matches with DOT's increased standard for average fuel economy. It also includes a "midterm review" to assess progress. Administrator Scott Pruitt's new EPA review, released on April 2, overturned the Obama administration's midterm review and concluded that the 2022 to 2025 standard was not feasible.
The EPA now argues that earlier assumptions behind the rule were "optimistic" and can't be met. However, its review almost entirely ignored the purpose of the standards and the costs of continuing to emit GHGs at high levels. Although the document is 38 pages long, the word "climate" never appears, and "carbon" appears only once.
The EPA's decision does not yet have any legal impact. It leaves the current standards in place until the EPA and DOT decide on a less-stringent replacement.
Can the Trump administration take away California's authority to set stricter targets?
The EPA has never attempted to revoke an existing waiver. In 2007, under George W. Bush, the agency denied California's request for a waiver to regulate motor vehicle GHG emissions. California sued, but the EPA reversed course under President Obama and granted the state a waiver before the case was resolved.
California's current waiver was approved in 2013 as a part of a "grand bargain" between California, federal agencies and automakers. It covers the state's Advanced Clean Cars program and includes standards to reduce conventional air pollutants like carbon monoxide, nitrogen oxides and particulate matter, as well as the GHG standards jointly developed with the EPA and DOT.
The Trump administration is threatening to revoke this waiver when it decouples the national GHG vehicle standards from California's standards. EPA Administrator Pruitt has said that the agency is re-examining the waiver, and that "cooperative federalism doesn't mean that one state can dictate standards for the rest of the country." In our view, this statement mischaracterizes how the Clean Air Act works. Other states have voluntarily chosen to follow California's rules because they see benefits in reducing air pollution.
The Trump Administration’s assault on clean car standards risks our ability to protect our children’s health, tackl… https://t.co/yYHUybng2E— Xavier Becerra (@Xavier Becerra)1522698925.0
How would California respond if the EPA revokes its waiver?
Gov. Jerry Brown, Attorney General Xavier Becerra and California Air Resources Board Chair Mary Nichols have all made clear that the state will push back. It's almost certain that any attempt to revoke or weaken California's waiver will immediately be challenged in court—and that this would be a major legal battle.
Reposted with permission from our media associate The Conversation.
A rare yellow penguin has been photographed for what is believed to be the first time.
- World-Renowned Photographer Documents Most Remote ... ›
- This Penguin Colony Has Fallen by 77% on Antarctic Islands ... ›
EcoWatch Daily Newsletter
By Stuart Braun
We spend 90% of our time in the buildings where we live and work, shop and conduct business, in the structures that keep us warm in winter and cool in summer.
But immense energy is required to source and manufacture building materials, to power construction sites, to maintain and renew the built environment. In 2019, building operations and construction activities together accounted for 38% of global energy-related CO2 emissions, the highest level ever recorded.
- Could IKEA's New Tiny House Help Fight the Climate Crisis ... ›
- Los Angeles City-Owned Buildings to Go 100% Carbon Free ... ›
- New Jersey Will Be First State to Require Building Permits to ... ›
Trending
By Eric Tate and Christopher Emrich
Disasters stemming from hazards like floods, wildfires, and disease often garner attention because of their extreme conditions and heavy societal impacts. Although the nature of the damage may vary, major disasters are alike in that socially vulnerable populations often experience the worst repercussions. For example, we saw this following Hurricanes Katrina and Harvey, each of which generated widespread physical damage and outsized impacts to low-income and minority survivors.
Mapping Social Vulnerability
<p>Figure 1a is a typical map of social vulnerability across the United States at the census tract level based on the Social Vulnerability Index (SoVI) algorithm of <a href="https://onlinelibrary.wiley.com/doi/abs/10.1111/1540-6237.8402002" target="_blank"><em>Cutter et al.</em></a> [2003]. Spatial representation of the index depicts high social vulnerability regionally in the Southwest, upper Great Plains, eastern Oklahoma, southern Texas, and southern Appalachia, among other places. With such a map, users can focus attention on select places and identify population characteristics associated with elevated vulnerabilities.</p>Fig. 1. (a) Social vulnerability across the United States at the census tract scale is mapped here following the Social Vulnerability Index (SoVI). Red and pink hues indicate high social vulnerability. (b) This bivariate map depicts social vulnerability (blue hues) and annualized per capita hazard losses (pink hues) for U.S. counties from 2010 to 2019.
<p>Many current indexes in the United States and abroad are direct or conceptual offshoots of SoVI, which has been widely replicated [e.g., <a href="https://link.springer.com/article/10.1007/s13753-016-0090-9" target="_blank"><em>de Loyola Hummell et al.</em></a>, 2016]. The U.S. Centers for Disease Control and Prevention (CDC) <a href="https://www.atsdr.cdc.gov/placeandhealth/svi/index.html" target="_blank">has also developed</a> a commonly used social vulnerability index intended to help local officials identify communities that may need support before, during, and after disasters.</p><p>The first modeling and mapping efforts, starting around the mid-2000s, largely focused on describing spatial distributions of social vulnerability at varying geographic scales. Over time, research in this area came to emphasize spatial comparisons between social vulnerability and physical hazards [<a href="https://doi.org/10.1007/s11069-009-9376-1" target="_blank"><em>Wood et al.</em></a>, 2010], modeling population dynamics following disasters [<a href="https://link.springer.com/article/10.1007%2Fs11111-008-0072-y" target="_blank" rel="noopener noreferrer"><em>Myers et al.</em></a>, 2008], and quantifying the robustness of social vulnerability measures [<a href="https://doi.org/10.1007/s11069-012-0152-2" target="_blank" rel="noopener noreferrer"><em>Tate</em></a>, 2012].</p><p>More recent work is beginning to dissolve barriers between social vulnerability and environmental justice scholarship [<a href="https://doi.org/10.2105/AJPH.2018.304846" target="_blank" rel="noopener noreferrer"><em>Chakraborty et al.</em></a>, 2019], which has traditionally focused on root causes of exposure to pollution hazards. Another prominent new research direction involves deeper interrogation of social vulnerability drivers in specific hazard contexts and disaster phases (e.g., before, during, after). Such work has revealed that interactions among drivers are important, but existing case studies are ill suited to guiding development of new indicators [<a href="https://doi.org/10.1016/j.ijdrr.2015.09.013" target="_blank" rel="noopener noreferrer"><em>Rufat et al.</em></a>, 2015].</p><p>Advances in geostatistical analyses have enabled researchers to characterize interactions more accurately among social vulnerability and hazard outcomes. Figure 1b depicts social vulnerability and annualized per capita hazard losses for U.S. counties from 2010 to 2019, facilitating visualization of the spatial coincidence of pre‑event susceptibilities and hazard impacts. Places ranked high in both dimensions may be priority locations for management interventions. Further, such analysis provides invaluable comparisons between places as well as information summarizing state and regional conditions.</p><p>In Figure 2, we take the analysis of interactions a step further, dividing counties into two categories: those experiencing annual per capita losses above or below the national average from 2010 to 2019. The differences among individual race, ethnicity, and poverty variables between the two county groups are small. But expressing race together with poverty (poverty attenuated by race) produces quite different results: Counties with high hazard losses have higher percentages of both impoverished Black populations and impoverished white populations than counties with low hazard losses. These county differences are most pronounced for impoverished Black populations.</p>Fig. 2. Differences in population percentages between counties experiencing annual per capita losses above or below the national average from 2010 to 2019 for individual and compound social vulnerability indicators (race and poverty).
<p>Our current work focuses on social vulnerability to floods using geostatistical modeling and mapping. The research directions are twofold. The first is to develop hazard-specific indicators of social vulnerability to aid in mitigation planning [<a href="https://doi.org/10.1007/s11069-020-04470-2" target="_blank" rel="noopener noreferrer"><em>Tate et al.</em></a>, 2021]. Because natural hazards differ in their innate characteristics (e.g., rate of onset, spatial extent), causal processes (e.g., urbanization, meteorology), and programmatic responses by government, manifestations of social vulnerability vary across hazards.</p><p>The second is to assess the degree to which socially vulnerable populations benefit from the leading disaster recovery programs [<a href="https://doi.org/10.1080/17477891.2019.1675578" target="_blank" rel="noopener noreferrer"><em>Emrich et al.</em></a>, 2020], such as the Federal Emergency Management Agency's (FEMA) <a href="https://www.fema.gov/individual-disaster-assistance" target="_blank" rel="noopener noreferrer">Individual Assistance</a> program and the U.S. Department of Housing and Urban Development's Community Development Block Grant (CDBG) <a href="https://www.hudexchange.info/programs/cdbg-dr/" target="_blank" rel="noopener noreferrer">Disaster Recovery</a> program. Both research directions posit social vulnerability indicators as potential measures of social equity.</p>Social Vulnerability as a Measure of Equity
<p>Given their focus on social marginalization and economic barriers, social vulnerability indicators are attracting growing scientific interest as measures of inequity resulting from disasters. Indeed, social vulnerability and inequity are related concepts. Social vulnerability research explores the differential susceptibilities and capacities of disaster-affected populations, whereas social equity analyses tend to focus on population disparities in the allocation of resources for hazard mitigation and disaster recovery. Interventions with an equity focus emphasize full and equal resource access for all people with unmet disaster needs.</p><p>Yet newer studies of inequity in disaster programs have documented troubling disparities in income, race, and home ownership among those who <a href="https://eos.org/articles/equity-concerns-raised-in-federal-flood-property-buyouts" target="_blank">participate in flood buyout programs</a>, are <a href="https://www.eenews.net/stories/1063477407" target="_blank" rel="noopener noreferrer">eligible for postdisaster loans</a>, receive short-term recovery assistance [<a href="https://doi.org/10.1016/j.ijdrr.2020.102010" target="_blank" rel="noopener noreferrer"><em>Drakes et al.</em></a>, 2021], and have <a href="https://www.texastribune.org/2020/08/25/texas-natural-disasters--mental-health/" target="_blank" rel="noopener noreferrer">access to mental health services</a>. For example, a recent analysis of federal flood buyouts found racial privilege to be infused at multiple program stages and geographic scales, resulting in resources that disproportionately benefit whiter and more urban counties and neighborhoods [<a href="https://doi.org/10.1177/2378023120905439" target="_blank" rel="noopener noreferrer"><em>Elliott et al.</em></a>, 2020].</p><p>Investments in disaster risk reduction are largely prioritized on the basis of hazard modeling, historical impacts, and economic risk. Social equity, meanwhile, has been far less integrated into the considerations of public agencies for hazard and disaster management. But this situation may be beginning to shift. Following the adage of "what gets measured gets managed," social equity metrics are increasingly being inserted into disaster management.</p><p>At the national level, FEMA has <a href="https://www.fema.gov/news-release/20200220/fema-releases-affordability-framework-national-flood-insurance-program" target="_blank">developed options</a> to increase the affordability of flood insurance [Federal Emergency Management Agency, 2018]. At the subnational scale, Puerto Rico has integrated social vulnerability into its CDBG Mitigation Action Plan, expanding its considerations of risk beyond only economic factors. At the local level, Harris County, Texas, has begun using social vulnerability indicators alongside traditional measures of flood risk to introduce equity into the prioritization of flood mitigation projects [<a href="https://www.hcfcd.org/Portals/62/Resilience/Bond-Program/Prioritization-Framework/final_prioritization-framework-report_20190827.pdf?ver=2019-09-19-092535-743" target="_blank" rel="noopener noreferrer"><em>Harris County Flood Control District</em></a>, 2019].</p><p>Unfortunately, many existing measures of disaster equity fall short. They may be unidimensional, using single indicators such as income in places where underlying vulnerability processes suggest that a multidimensional measure like racialized poverty (Figure 2) would be more valid. And criteria presumed to be objective and neutral for determining resource allocation, such as economic loss and cost-benefit ratios, prioritize asset value over social equity. For example, following the <a href="http://www.cedar-rapids.org/discover_cedar_rapids/flood_of_2008/2008_flood_facts.php" target="_blank" rel="noopener noreferrer">2008 flooding</a> in Cedar Rapids, Iowa, cost-benefit criteria supported new flood protections for the city's central business district on the east side of the Cedar River but not for vulnerable populations and workforce housing on the west side.</p><p>Furthermore, many equity measures are aspatial or ahistorical, even though the roots of marginalization may lie in systemic and spatially explicit processes that originated long ago like redlining and urban renewal. More research is thus needed to understand which measures are most suitable for which social equity analyses.</p>Challenges for Disaster Equity Analysis
<p>Across studies that quantify, map, and analyze social vulnerability to natural hazards, modelers have faced recurrent measurement challenges, many of which also apply in measuring disaster equity (Table 1). The first is clearly establishing the purpose of an equity analysis by defining characteristics such as the end user and intended use, the type of hazard, and the disaster stage (i.e., mitigation, response, or recovery). Analyses using generalized indicators like the CDC Social Vulnerability Index may be appropriate for identifying broad areas of concern, whereas more detailed analyses are ideal for high-stakes decisions about budget allocations and project prioritization.</p>Wisconsin will end its controversial wolf hunt early after hunters and trappers killed almost 70 percent of the state's quota in the hunt's first 48 hours.
By Jessica Corbett
Sen. Bernie Sanders on Tuesday was the lone progressive to vote against Tom Vilsack reprising his role as secretary of agriculture, citing concerns that progressive advocacy groups have been raising since even before President Joe Biden officially nominated the former Obama administration appointee.