
 568k
568k  233k
233k  41k
41k  Subscribe
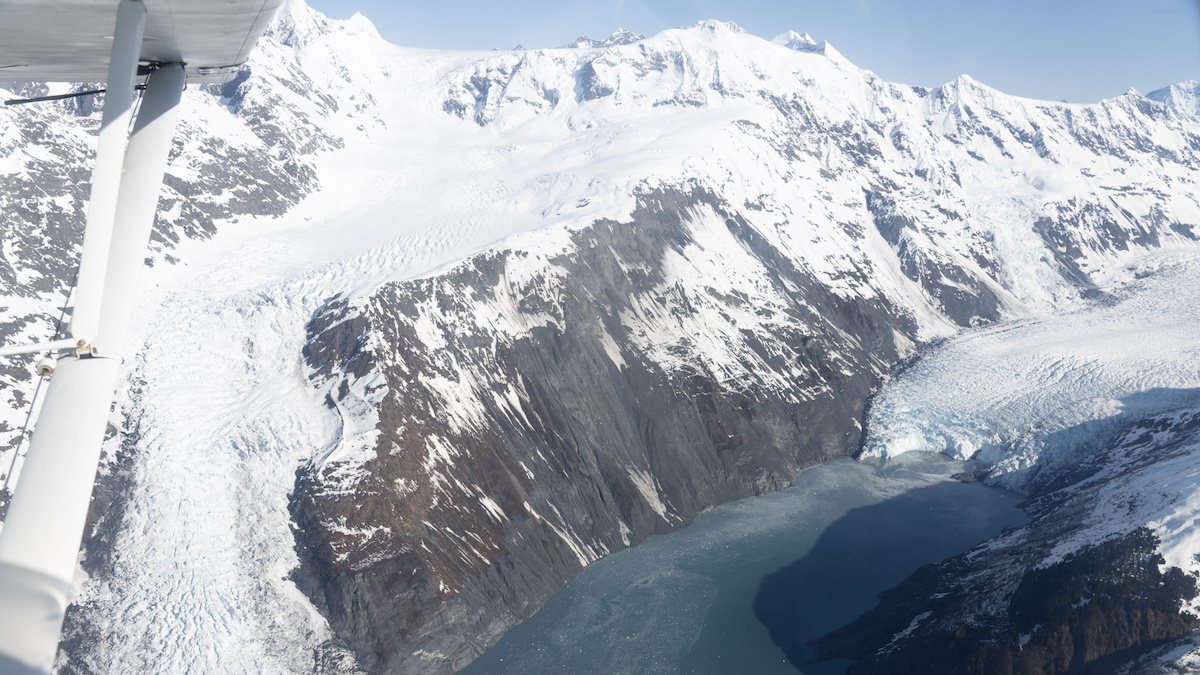
An unstable slope above Barry Glacier in Barry Arm, Alaska, could trigger a landslide and major tsunami. Christian Zimmerman / USGS
As the climate crisis takes hold, the effects are noticed most conspicuously at the extremes like the poles and the desert, where the harsh environments are drastically altered by a changing climate.
The latest evidence is from a melting glacier in Alaska that may trigger a landslide that catalyzes a major tsunami, scientists warned on Thursday, as The New York Times reported.
A public letter signed by several scientists warns it’s possible that the landslide and tsunami could happen “within the next year, and likely within 20 years,” and detailed potentially devastating effects.
The scientists warn that an unstable, mile-long slope that sits above Prince William Sound, about 60 miles east of Anchorage, is supported only by a glacier in retreat. Warming temperatures have caused the ice to melt, leaving only one-third of the slope supported by ice. That means an earthquake, a heat wave, or prolonged heavy rain could trigger a landslide, according to The New York Times.
If the slope above Barry Glacier crumbled, it could impact tourism, fishing and hunting, according to the letter. It could also lead to 30-foot waves that reach the town of Whittier, 28 miles away across Prince William Sound, according to the Anchorage Daily News.
The glacier’s retreat “could release millions of tons of rock into the Harriman Fiord, triggering a tsunami at least as large as some of the largest in the state’s recorded history,” according to a statement from the Alaska Division of Geological and Geophysical Surveys, as the Anchorage Daily News reported.
The Alaska Department of Natural Resources and the state Department of Fish and Game responded to the warning from the scientists by issuing a warning that “strongly recommend people avoid all the identified danger zones until the hazards can be adequately understood and characterized,” according to the Anchorage Daily News.
“As a hazard, it’s really worrisome,” said researcher, Hig Higman, who studies geological hazards and runs an organization called Ground Truth based in Seldovia, Alaska, to The New York Times.
The tsunami models produced by Patrick Lynett at the University of Southern California show a tsunami reaching hundreds of feet in elevation, with the ability to reach Whittier within 20 minutes. Other cities on the Prince William Sound, like Valdez and Cordova, could also see less destructive waves that may damage harbors and docks and threaten people in those areas, according to KTUU, Anchorage’s NBC News affiliate.
The computer model shows that a collapse of the entire slope—roughly estimated to be 500 million cubic meters of rock and dirt, or several hundred times the volume of the Hoover Dam—may trigger a tsunami that starts out at several hundred feet high, according to The New York Times.
Since the slope has been moving for decades, the researchers estimated that the landslide is possible within a year and almost certain to happen within the next two decades. “It could happen anytime, but the risk just goes way up as this glacier recedes,” said Anna Liljedahl, an Alaska-based hydrologist with the Woods Hole Research Center in Massachusetts, who was part of the team, to The New York Times.
While the research has not yet been peer-reviewed, Liljedahl said the researchers wanted to get the information out to inform the public of a looming threat.
“We wanted to let the public know that there is a chance that this landslide might fail catastrophically,” Liljedahl said, as the Anchorage Daily News reported. “There’s also a chance that it might not.”