
 568k
568k  233k
233k  41k
41k  Subscribe
The Revelator
By Dipika Kadaba
Having a little trouble breathing lately? That’s no surprise. Air pollution is already bad in many parts of the country, and climate change is only going to make it worse. Even though many industries are reducing their emissions, a warming climate could actually offset these reductions by intensifying the rates of chemical reactions and accumulation of pollutants in the environment.
Scientists already identify air pollution as the largest environmental health risk around the world today. In order to understand future risk, researchers from MIT recently modeled the impacts of unmitigated greenhouse gas emissions on toxic air pollutants. They found increased levels of air pollution across the country, with some regions being hit hard enough to create unhealthy conditions. These predicted changes, according to the EPA, could cost the country 57,000 additional premature deaths and $930 billion in lost economic benefits by the end of the century. That’s bad enough, but even those projections leave off the temporary effects of wildfires and other air-quality threats, which will also be made worse by climate change.
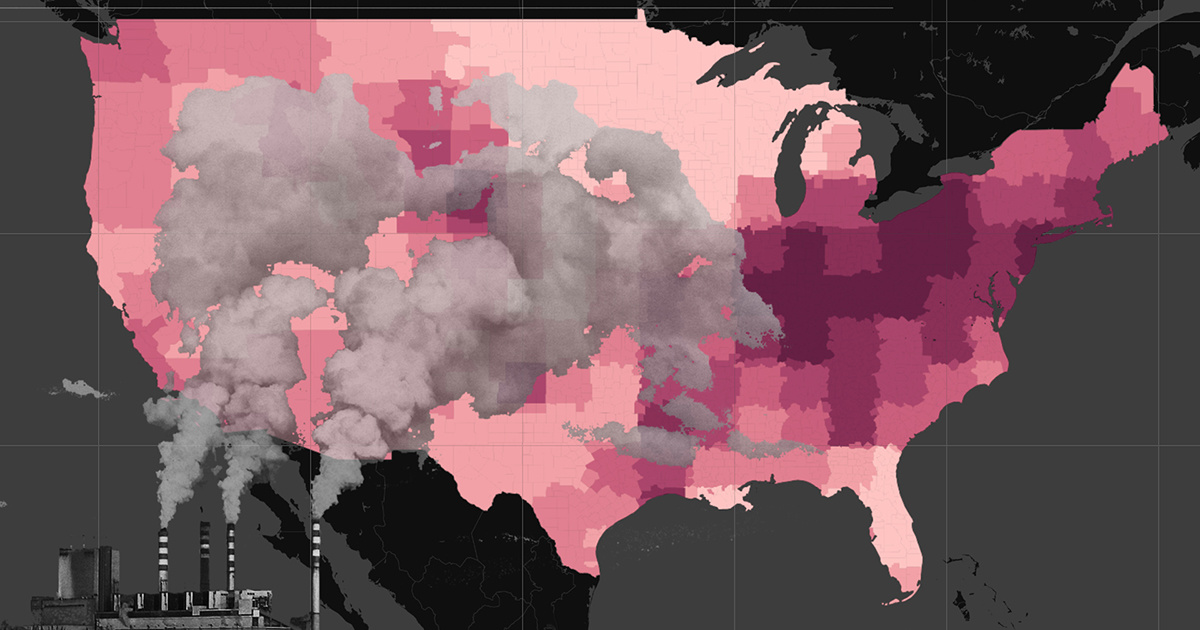
So how bad are your neighborhood’s conditions in these projections? Explore our map below to see which regions can expect the biggest annual changes in the most dangerous levels of particulate air pollution—PM2.5—by 2100.
(Darker colors indicate greater increases. Click on counties on mobile, or mouse over them on desktop.)
Sources and Methods:
Estimated change in annual-average fine particulate matter (PM2.5, μg m-3) from 2000 to 2100 under the Reference scenario from EPA.
Annual PM2.5 concentration for 2000 by SEDAC/NASA.
Projected PM2.5 2100 level obtained by adding estimated change data to PM2.5 2000 data.
Tools:
ArcGIS Pro
Reposted with permission from our media associate The Revelator.