
 568k
568k  233k
233k  41k
41k  Subscribe

By John R. Platt
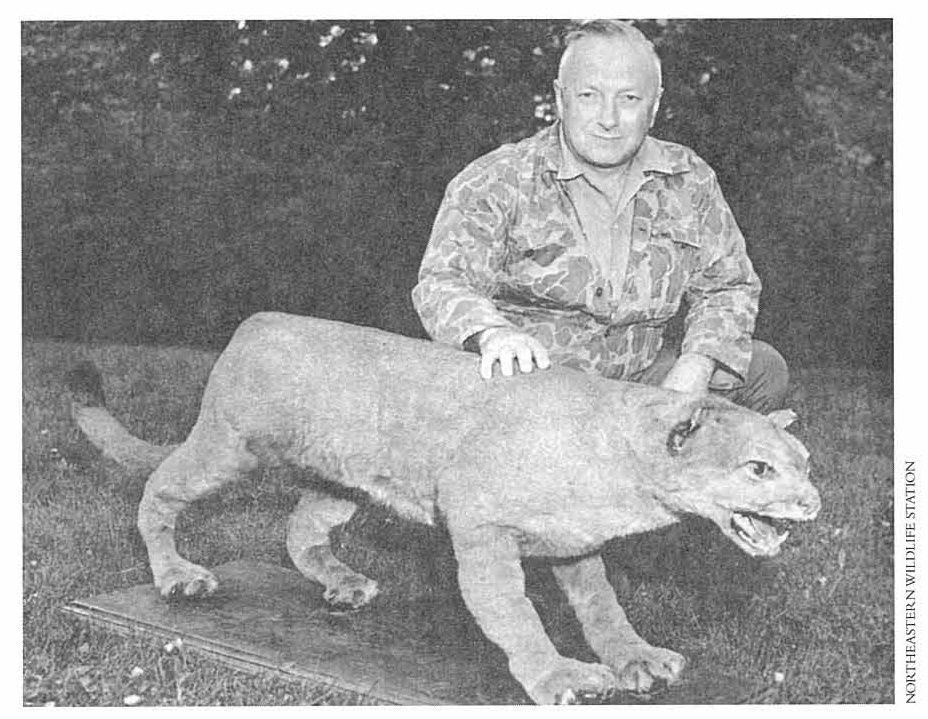
Say good-bye to the “ghost cat.” This week the U.S. Fish and Wildlife Service officially declared the eastern cougar (Puma concolor couguar) to be extinct and removed it from the endangered species list.
This news, sad though it is, has been a long time coming. The big cats, once native to New England, were last verifiably observed back in 1938. The service first concluded that the species was extinct back in 2011, and then proposed removing its protected status in 2015. This latest step, taken after extensive scientific review and public comment, completes the eastern cougar’s long journey into the night.
Eastern cougars—also known as “ghost cats,” catamounts, panthers and, of course, mountain lions—disappeared after decades of overhunting on multiple fronts. The large predators were seen as threats to livestock, which resulted in the cats being actively hunted and bounties placed on their heads.
On top of that, the cats also ran out of their primary prey, deer, which were themselves hunted into near-extinction. “White-tailed deer were nearly eradicated from the eastern U.S. in the late 1800s,” service biologist Mark McCollough told me in 2011. “The few cougars that survived [after that] would have had very little food to support them.”
Biologist Bruce Wright poses with the body of the last known eastern cougar in 1938. USFWS
Extinct or not, the eastern cougar remains a vital part of New England culture and mythology. Several boys’ and girls’ sports teams in the region are still called the Cougars or Catamounts, and people still think they see the animals quite frequently, although these sightings are usually later proven to be bobcats, lynx or other animals. A few New England sightings, however, have been confirmed to be escaped captive cougars of other subspecies. One of the most credible reports took place just a couple of miles from where I used to live in Wiscasset, Maine.
Meanwhile cougars from the West are actually expanding their range and repopulating areas where they had once been exterminated. Most of those settle in the Midwest, but one famous mountain lion trekked all the way from the Black Hills of South Dakota to Connecticut a few years ago—a journey of about 2,000 miles.
That particular cat died after being struck by an SUV—like so many of its Florida panther cousins—but it may not be the last western panther to make New England its home, even temporarily. Many experts feel the Maine woods and other New England locations hold a lot of potential as a possible sites for cougar rewilding as the species continues its eastward expansion. “Biologically, it wouldn’t be hard to resettle them,” McCollough said at a meeting in Damariscotta, Maine, last year. “They could adapt to the East.”
That would be too little, too late to make up for the extinction of the eastern cougar, but who knows, maybe one day soon the forests of New England will once again have their own populations of breeding big cats, not just the ghosts that used to live there.
Reposted with permission from our media associate The Revelator.