
 568k
568k  233k
233k  41k
41k  Subscribe
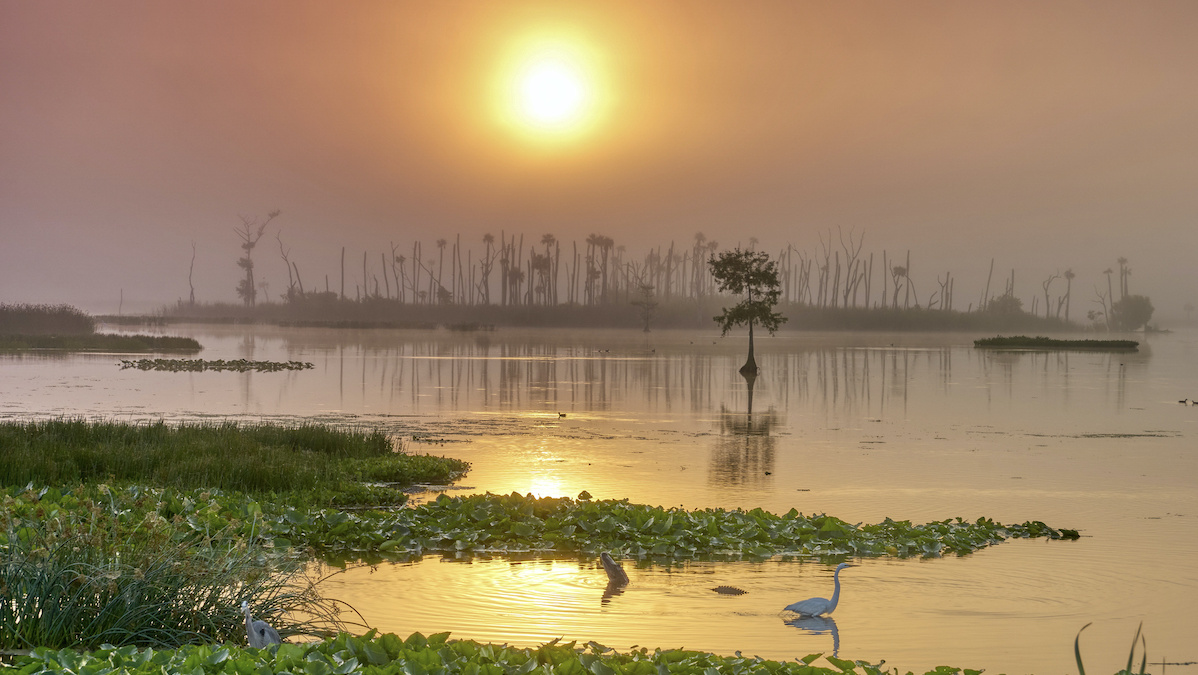
Orlando Wetlands Park in central Florida. Bkamprath / iStock/ Getty Images Plus
By Kimberly M.S. Cartier
Mangrove forests, marshes and seagrass beds protect inland areas from storm surges and strong winds. Over long periods, coastal wetlands like these build up sediment that mitigates sea level rise and local land subsidence.
A new analysis of property damage from Atlantic and Gulf of Mexico coastal storms has shown that counties with larger wetlands suffered lower property damage costs than did counties with smaller wetlands.
“Starting in 1996, the U.S. government started to produce damage estimates for each tropical cyclone in a consistent manner,” explained coauthor Richard Carson, an economist at the University of California, San Diego (UCSD) in La Jolla. Before that, the data were collected only for hurricanes, which hindered past attempts to put a price on the marginal value, or price per unit, of wetlands, he said.
With the complete data set, the researchers examined all 88 tropical cyclones and hurricanes that affected the U.S. starting in 1996. That time period includes Hurricanes Katrina and Sandy.
A Protective and Economic Boon
In addition to property damage data for tropical cyclones of all strengths, “our data set has considerably more spatial resolution,” Carson said, “which is a result of large amounts of information on storm tracks, property location, and wetland location all being digitized for use in a geographical information system basis.”
First author Fanglin Sun, formerly at UCSD and now an economist at Amazon.com, added that “areas subject to flood risk in a county are more accurately estimated, based on local elevation data and detailed information on individual storm trajectories” and wind speeds throughout affected areas.
The finer level of detail for the storm data let the researchers finally begin connecting wetland coverage and storm damage on a county-by-county basis, Carson said. “A storm track moving a couple of kilometers one direction or the other allows the amount of wetland protection to vary within the same county.”
In terms of property damage, Sun and Carson found that a square kilometer of wetlands saved an average of .8 million per year. Over the next 30 years, an average unit of wetlands could save million in storm damage.
Some wetlands were valued at less than 0 per year per square kilometer and some at nearly 0 million. That marginal value depended on many factors, including a county’s property values, existing wetland coverage, coastline shape, elevation, building codes, and chance of actually experiencing damaging winds. And each of those variables fluctuated over the 20 years the team studied.
Overall, the highest-valued wetlands were in urban counties with large populations and the lowest-valued were in rural areas with small populations. However, wetlands provided a greater relative savings against weaker cyclones and in counties with less stringent building codes — areas that might not expect or plan for a tropical storm.
The team found no significant difference in the marginal value of saltwater versus freshwater wetlands or mangroves versus marshes. “Forested wetlands tend to be better at reducing wind speed and marshes tend to be better at absorbing water,” Carson said, “so the specific nature of the storm when it hits an area is likely to matter. [But] our results suggest that, on average, there is no difference.”
The team published these results in Proceedings of the National Academy of Sciences of the United States of America on March 3.
Wetlands at Risk
Most areas that have experienced storm-related property damage in the past 20 years have also lost wetland coverage, the researchers found. They calculated that Floridians would have been spared 0 million in property damage from Hurricane Irma alone had the state’s wetland coverage not shrunk by 2.8% in the decade prior.
Moreover, recent changes to the Clean Water Act have made the remaining coastal wetlands more vulnerable.
“The federal government, with respect to the U.S. Clean Water Act, took the position that the previous wetland studies were not reliable enough for use in assessing the benefits and cost of protecting wetlands,” Carson said.
“The value coastal wetlands provide for storm protection is substantial and should be taken into account as policy makers debate the Clean Water Act,” Sun said. “It’s also worth noting,” she added, “that storm protection for property is just one of many ecological services that wetlands provide. We hope our study will spur future research quantifying these other services as well.”
With tropical storms and hurricanes expected to happen more often because of climate change, the team wrote, wetlands will be more economically valuable than ever.
Reposted with permission from The Revelator.
- Saving the World's Largest Tropical Wetland - EcoWatch
- Protecting the World's Wetlands: 5 Essential Reads - EcoWatch
- How Protecting Wetlands Can Help the Climate - EcoWatch
- How to Save Saltwater Wetlands From Rising Seas
- Nearly Half of U.S. Coastal Marshes Are Vulnerable to Sea Level Rise, Study Finds