
 568k
568k  233k
233k  41k
41k  Subscribe
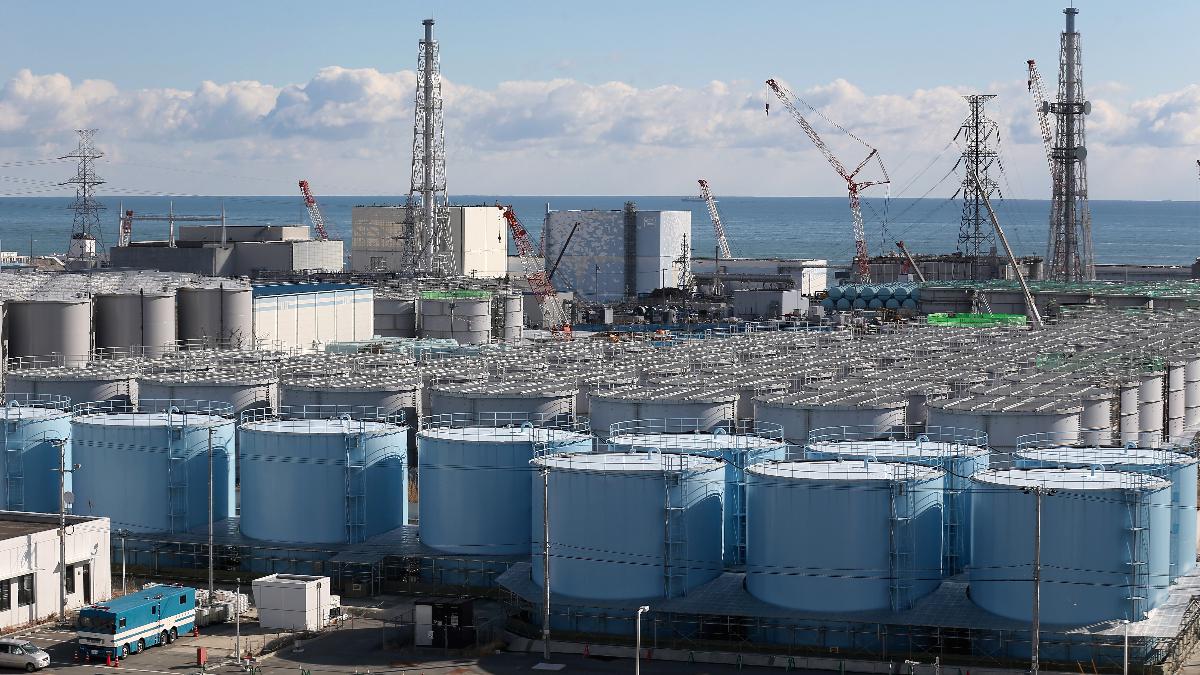
Radiation-contaminated water tanks and damaged reactors at the Fukushima Daiichi nuclear power plant on Feb. 25, 2016 in Okuma, Japan. Christopher Furlong / Getty Images
Japan will release radioactive wastewater from the failed Fukushima nuclear plant into the Pacific Ocean, the government announced on Tuesday.
The water will be treated before release, and the International Atomic Energy Agency said the country’s plans were in keeping with international practice, The New York Times reported. But the plan is opposed by the local fishing community, environmental groups and neighboring countries. Within hours of the announcement, protesters had gathered outside government offices in Tokyo and Fukushima, according to NPR.
“The Japanese government has once again failed the people of Fukushima,” Greenpeace Japan Climate and Energy Campaigner Kazue Suzuki said in a statement. “The government has taken the wholly unjustified decision to deliberately contaminate the Pacific Ocean with radioactive wastes.”
The dilemma of how to dispose of the water is one ten years in the making. In March 2011, an earthquake and tsunami in northeastern Japan killed more than 19,000 people and caused three of six reactors at the Fukushima Daiichi nuclear power plant to melt down, The New York Times explained. This resulted in the biggest nuclear disaster since Chernobyl, and the cleanup efforts persist more than a decade later.
To keep the damaged reactors from melting down, cool water is flushed through them and then filtered to remove all radioactive material except for tritium. Up until now, the wastewater has been stored on site, but the government says the facility will run out of storage room next year. Water builds up at 170 tons per day, and there are now around 1.25 million tons stored in more than 1,000 tanks.
The government now plans to begin releasing the water into the ocean in two years time, according to a decision approved by cabinet ministers Tuesday. The process is expected to take decades.
“On the premise of strict compliance with regulatory standards that have been established, we select oceanic release,” the government said in a statement reported by NPR.
Opposition to the move partly involves a lack of trust around what is actually in the water, as NPR reported. Both the government and Tokyo Electric Power Co., which operates the plant, say that the water only contains tritium, which cannot be separated from hydrogen and is only dangerous to humans in large amounts.
“But it turned out that the water contains more radioactive materials. But they didn’t disclose that information before,” Friends of the Earth Japan campaigner Ayumi Fukakusa told NPR. “That kind of attitude is not honest to people. They are making distrust by themselves.”
In February, for example, a rockfish shipment was stopped when a sample caught near Fukushima tested positive for unsafe levels of cesium.
This incident also illustrates why local fishing communities oppose the release. Fish catches are already only 17.5 percent of what they were before the disaster, and the community worries the release of the water will make it impossible for them to sell what they do catch. They also feel the government went against its promises by deciding to release the water.
“They told us that they wouldn’t release the water into the sea without the support of fishermen,” fishery cooperative leader Kanji Tachiya told national broadcaster NHK, as CBS News reported. “We can’t back this move to break that promise and release the water into the sea unilaterally.”
Japan’s neighbors also questioned the move. China called it “extremely irresponsible,” and South Korea asked for a meeting with the Japanese ambassador in Seoul in response.
The U.S. State Department, however, said that it trusted Japan’s judgement.
“In this unique and challenging situation, Japan has weighed the options and effects, has been transparent about its decision, and appears to have adopted an approach in accordance with globally accepted nuclear safety standards,” the department said in a statement reported by The New York Times.
But environmentalists argue that the government could have found a way to continue storing waste.
“Rather than using the best available technology to minimize radiation hazards by storing and processing the water over the long term, they have opted for the cheapest option, dumping the water into the Pacific Ocean,” Greenpeace’s Suzuki said.
- Japan's New Environmental Minister Calls for Closing Down All ...
- Radiation Along Fukushima Rivers Up to 200 Times Higher Than ...
- Nuclear Energy 101: What Exactly Are Small Modular Reactors?
- Nuclear Energy 101: What Exactly Are Small Modular Reactors?