
Water, as we all know, is a terrible thing to waste. But for businesses that go through a lot of water—dairy farmers, wineries and sewage plants—vast quantities of wastewater is an unfortunate byproduct.
But since 1995, Chilean company BioFiltro has recycled more than 28 billion gallons of water to date with this humble organism: the worm.
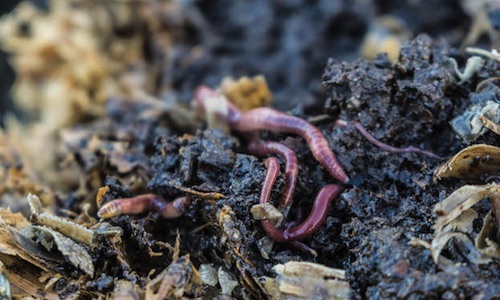
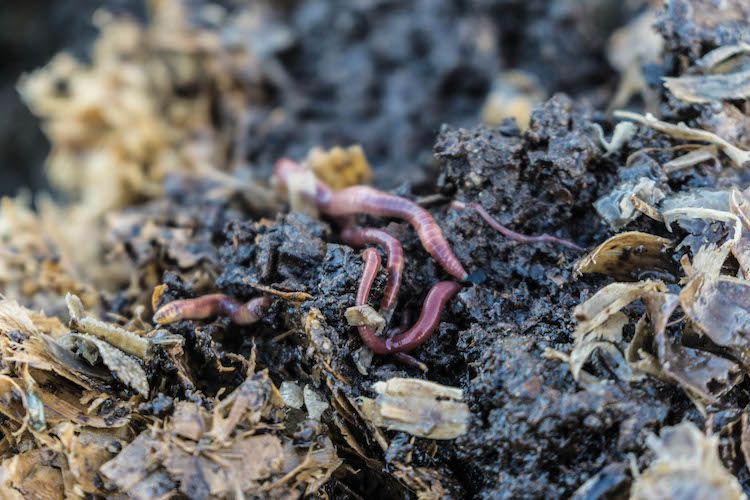
Red worms remove up to 99 percent of wastewater contaminants in four hours in the BIDA System.
The worm's invaluable contribution to crop health goes all the way back to Charles Darwin, who detailed their digestive capabilities in his 1881 book, The Formation of Vegetable Mould Through The Action of Worms.
BioFiltro's BIDA System is a closed-loop biological wastewater treatment system. The worm-and-bacteria powered process can remove up to 99 percent of Biological Oxygen Demand (BOD) and Total Suspended Solids (TSS) and 70-90 percent removal of nitrogen, oil and grease in four hours, according to BioFiltro’s regional manager Mai Ann Healy.
Healy told EcoWatch that "most other treatment systems require days, if not weeks, to achieve these results."
BioFiltro currently has 129 facilities installed in six countries. They process the wastewater from the Chilean Air Force Base on Antarctica as well as the Atacama Desert, which is the driest desert in the world. The company is currently constructing plants in California to serve the needs of food processors, wineries, waste haulers and sanitary waste, Healy said.
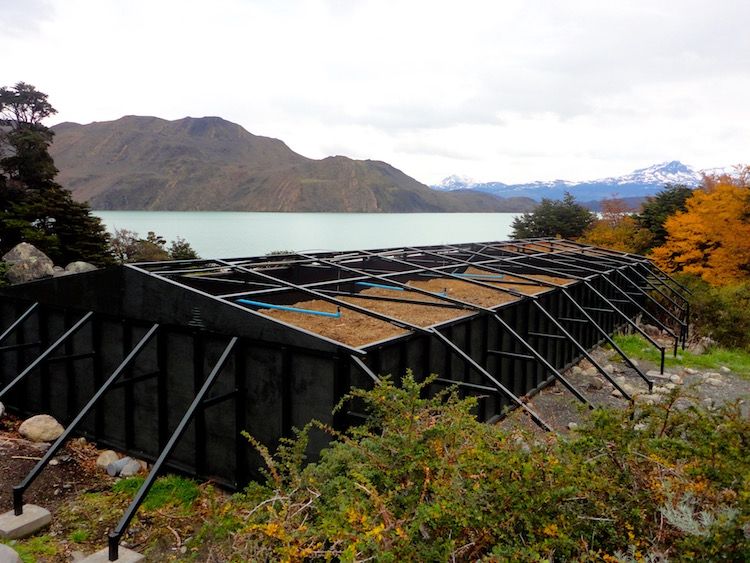
The BioFiltro plant in Torres del Paine National Park in Patagonia, Chile.
Recently, the company teamed up with Fetzer Vineyards to become the first winery the U.S. to use the system to process 100 percent of its wastewater. The Mendocino, California-based winery will use "billions" of earthworms to process its winery wastewater during the 2016 harvest season, a press release states. In doing so, Fetzer will accrue energy savings up to 85 percent over current wastewater treatment technologies.
Healy took the time to answer a few of EcoWatch's questions via email.
EcoWatch: What makes worms so good at filtering wastewater?
Healy: Worms in and of themselves are not great at filtering wastewater. Rather, worms target the solids (or TSS) and break this waste down in their stomachs. Their excrement (worm castings) are rich in microbial activity.
This bacteria is aerobic, or needs air to function, and the burrowing earthworms create air channels throughout our system thereby bringing air to these tiny soldiers and creating an optimum living environment. This symbiotic relationship between worms and bacteria is what powers our systems, as the bacteria target the BOD of wastewater, the worms target the TSS and nitrogen.
Ultimately, our BIDA System converts wastewater into a reusable asset and contaminants into nutritious fertilizer onsite.
EcoWatch: Can I drink worm-filtered water?
Healy: You cannot drink the water that comes straight out of our system. In the wastewater world, the term is primary, secondary and tertiary filtration. Our systems as a stand-alone provide secondary filtration. Water from secondary filtration can be reutilized for select agricultural purposes but not human consumption. Water for human consumption must have tertiary filtration which is a disinfection process.
Almost 5pm and #worms are thirsty for #wastewater. Contact us for #sustainable WWT solutions #FridayFeeling https://t.co/Aru8OUSG2U— BioFiltro (@BioFiltro)1460755966.0
EcoWatch: Who started the company and why?
Healy: The first commercial scale plant was installed in 1995 by our chief technology officer, Alex Villagra. He first started studying the ability of worms to digest waste and wastewater while he was studying at the University of Chile and accredits his continued interest to the fact that "oftentimes the answers to the world's most complex problems are right in front of us—products of billions of years of research and development, mother nature shows us, through her natural processes and designs, that she does know best."
Villagra spent many years going through iterations of design, bacteria and worms. In 2010, Villagra teamed up with Matias Sjogren and Rafael Concha, all three of whom are engineers, to form what is now BioFiltro. The mission was to scale and globalize this revolutionary approach as all three are inspired to show the world how natural processes are capable of not only treating wastewater in a more efficient way, but also procuring a safer environment for future generations.
EcoWatch: Why are earthworms/microbes ideal for winery wastewater?
Healy: Winery wastewater is rich in sugars—worms and bacteria love sugar. The amount of worms present in our system is related to the wastewater quality—facilities that discharge water high in sugars, proteins, and fats (so wineries, milk/cheese/ice cream plants, slaughterhouses) have a very dense worm population.
EcoWatch: Are there really billions of worms in Fetzer's system?
Healy: We have some systems that achieve worm densities of 12,000 worms per cubic yard and that's not counting all the microscopic biology present. Fetzer’s system will have billions of worms and bacteria working tirelessly to reduce waste.
Honored that @fetzerwines is installing our system to treat #wastewater with #worms https://t.co/uyzZ8yPCKK https://t.co/J4qyZc7tUC— BioFiltro (@BioFiltro)1459964672.0
EcoWatch: How big or deep is the BIDA System? What does inside of it?
Healy: The layers are described here but essentially our BIDA System is an open-top structure, typically made out of concrete (concrete floor, 4 walls, open top). The layers, from bottom to top, are 1. drainage basins placed on the floor which create an air chamber; 2. geotextiles; 3. river cobble; 4. wood shavings. The size depends on how many gallons will be applied per day as well as the contaminant level—the dirtier the water, the larger our system.
When BioFiltro commissions a plant, we inoculate the wood shavings with a specific mix of worms and bacteria. Our systems are modular and scalable, so we can serve the needs of an individual household up to mega food processors. Our largest facility is a 2 million gallon per day food processor in Chile.
EcoWatch: What kind of maintenance does it require?
Healy: Our telemetry system is constantly monitoring various water quality parameters so that BioFiltro can ensure optimum system performance. Major maintenance tasks are executed by BioFiltro and consist of removing the worm castings. Over time, the top layer turns into castings (worm poop), which is a natural and highly nutritious fertilizer, and the castings must be harvested to keep the system aerobic. When we do this, we simply replenish with a layer of fresh wood shavings. Occasionally BioFiltro must also separate and remove worms from the system as they multiply exponentially.
BioFiltro's treated wastewater can be reutilized for certain agricultural purposes.
EcoWatch: What makes the BIDA System unique? What are some of the advantages of using it?
Healy: It's energy-efficient. We use up to 95 percent less energy than traditional wastewater technologies to deliver the same, if not better, quality effluent. Many dischargers could spend hundreds of thousands of dollars, if not millions, each year just to power the aerators used to clean their water. Fetzer, for example, is expecting to reduce its energy consumption by 1 million kWh each year as a result of implementing our system.
It's natural. Our standalone BIDA System does not require the use of any chemicals. It’s also virtually odor-free as we process the wastewater within approximately four hours of being discharged from the client’s facility.
It's sludge-free. Since our worms and bacteria digest everything there is no sludge, which is a typical byproduct of wastewater treatment. The only "byproduct" of our system is the nutritious castings which are actually a highly sought-after value-added product.
It's simple to operate. We design our system with the client in mind and, thanks to our telemetry monitoring system, can provide a largely hands-off wastewater treatment solution. The client can therefore focus on their core business while our system runs automatically and mostly autonomously.
The BIDA System is a decentralized closed system. By offering a complete wastewater treatment system that is easy to operate, we empower rural clients and communities who otherwise would have no access to fresh water. For example, we have a site in Patagonia, in Torres del Paine National Park, which is inaccessible by car and needs to treat its water so that it does not pollute the beautiful landscape around it. There, we enable them to responsibly care for their site. In other communities, we empower those with limited access to recycle water for agricultural purposes.
EcoWatch: What are the goals of the company?
Healy: The goal is to prove that this natural process, a product built on 21 years of R&D, offers the best solution to wastewater technology. We have treated more than 28 billion gallons of wastewater. Our motivation is to implement water filtration systems that reduce dependency on freshwater sources while improving the environment in which our clients operate.
Where there's a #worm there's a #wastewater way! Supplying our #natural #wastewater plant in #patagonia #chile https://t.co/pl5YgdMwIQ— BioFiltro (@BioFiltro)1460155466.0
YOU MIGHT ALSO LIKE
One of the World’s Largest Hospitality Chains to Grow Its Own Vegetables at 1,000 Hotels
Costco Lends Money to Farmer to Buy More Land to Meet Growing Demand for Organics
3 Solar Ovens That Give You the Power to Cook With the Sun
World’s First Plastic Fishing Company Wants to Rid the Oceans of Plastic Pollution
A rare yellow penguin has been photographed for what is believed to be the first time.
- World-Renowned Photographer Documents Most Remote ... ›
- This Penguin Colony Has Fallen by 77% on Antarctic Islands ... ›
EcoWatch Daily Newsletter
By Stuart Braun
We spend 90% of our time in the buildings where we live and work, shop and conduct business, in the structures that keep us warm in winter and cool in summer.
But immense energy is required to source and manufacture building materials, to power construction sites, to maintain and renew the built environment. In 2019, building operations and construction activities together accounted for 38% of global energy-related CO2 emissions, the highest level ever recorded.
- Could IKEA's New Tiny House Help Fight the Climate Crisis ... ›
- Los Angeles City-Owned Buildings to Go 100% Carbon Free ... ›
- New Jersey Will Be First State to Require Building Permits to ... ›
Trending
By Eric Tate and Christopher Emrich
Disasters stemming from hazards like floods, wildfires, and disease often garner attention because of their extreme conditions and heavy societal impacts. Although the nature of the damage may vary, major disasters are alike in that socially vulnerable populations often experience the worst repercussions. For example, we saw this following Hurricanes Katrina and Harvey, each of which generated widespread physical damage and outsized impacts to low-income and minority survivors.
Mapping Social Vulnerability
<p>Figure 1a is a typical map of social vulnerability across the United States at the census tract level based on the Social Vulnerability Index (SoVI) algorithm of <a href="https://onlinelibrary.wiley.com/doi/abs/10.1111/1540-6237.8402002" target="_blank"><em>Cutter et al.</em></a> [2003]. Spatial representation of the index depicts high social vulnerability regionally in the Southwest, upper Great Plains, eastern Oklahoma, southern Texas, and southern Appalachia, among other places. With such a map, users can focus attention on select places and identify population characteristics associated with elevated vulnerabilities.</p>Fig. 1. (a) Social vulnerability across the United States at the census tract scale is mapped here following the Social Vulnerability Index (SoVI). Red and pink hues indicate high social vulnerability. (b) This bivariate map depicts social vulnerability (blue hues) and annualized per capita hazard losses (pink hues) for U.S. counties from 2010 to 2019.
<p>Many current indexes in the United States and abroad are direct or conceptual offshoots of SoVI, which has been widely replicated [e.g., <a href="https://link.springer.com/article/10.1007/s13753-016-0090-9" target="_blank"><em>de Loyola Hummell et al.</em></a>, 2016]. The U.S. Centers for Disease Control and Prevention (CDC) <a href="https://www.atsdr.cdc.gov/placeandhealth/svi/index.html" target="_blank">has also developed</a> a commonly used social vulnerability index intended to help local officials identify communities that may need support before, during, and after disasters.</p><p>The first modeling and mapping efforts, starting around the mid-2000s, largely focused on describing spatial distributions of social vulnerability at varying geographic scales. Over time, research in this area came to emphasize spatial comparisons between social vulnerability and physical hazards [<a href="https://doi.org/10.1007/s11069-009-9376-1" target="_blank"><em>Wood et al.</em></a>, 2010], modeling population dynamics following disasters [<a href="https://link.springer.com/article/10.1007%2Fs11111-008-0072-y" target="_blank" rel="noopener noreferrer"><em>Myers et al.</em></a>, 2008], and quantifying the robustness of social vulnerability measures [<a href="https://doi.org/10.1007/s11069-012-0152-2" target="_blank" rel="noopener noreferrer"><em>Tate</em></a>, 2012].</p><p>More recent work is beginning to dissolve barriers between social vulnerability and environmental justice scholarship [<a href="https://doi.org/10.2105/AJPH.2018.304846" target="_blank" rel="noopener noreferrer"><em>Chakraborty et al.</em></a>, 2019], which has traditionally focused on root causes of exposure to pollution hazards. Another prominent new research direction involves deeper interrogation of social vulnerability drivers in specific hazard contexts and disaster phases (e.g., before, during, after). Such work has revealed that interactions among drivers are important, but existing case studies are ill suited to guiding development of new indicators [<a href="https://doi.org/10.1016/j.ijdrr.2015.09.013" target="_blank" rel="noopener noreferrer"><em>Rufat et al.</em></a>, 2015].</p><p>Advances in geostatistical analyses have enabled researchers to characterize interactions more accurately among social vulnerability and hazard outcomes. Figure 1b depicts social vulnerability and annualized per capita hazard losses for U.S. counties from 2010 to 2019, facilitating visualization of the spatial coincidence of pre‑event susceptibilities and hazard impacts. Places ranked high in both dimensions may be priority locations for management interventions. Further, such analysis provides invaluable comparisons between places as well as information summarizing state and regional conditions.</p><p>In Figure 2, we take the analysis of interactions a step further, dividing counties into two categories: those experiencing annual per capita losses above or below the national average from 2010 to 2019. The differences among individual race, ethnicity, and poverty variables between the two county groups are small. But expressing race together with poverty (poverty attenuated by race) produces quite different results: Counties with high hazard losses have higher percentages of both impoverished Black populations and impoverished white populations than counties with low hazard losses. These county differences are most pronounced for impoverished Black populations.</p>Fig. 2. Differences in population percentages between counties experiencing annual per capita losses above or below the national average from 2010 to 2019 for individual and compound social vulnerability indicators (race and poverty).
<p>Our current work focuses on social vulnerability to floods using geostatistical modeling and mapping. The research directions are twofold. The first is to develop hazard-specific indicators of social vulnerability to aid in mitigation planning [<a href="https://doi.org/10.1007/s11069-020-04470-2" target="_blank" rel="noopener noreferrer"><em>Tate et al.</em></a>, 2021]. Because natural hazards differ in their innate characteristics (e.g., rate of onset, spatial extent), causal processes (e.g., urbanization, meteorology), and programmatic responses by government, manifestations of social vulnerability vary across hazards.</p><p>The second is to assess the degree to which socially vulnerable populations benefit from the leading disaster recovery programs [<a href="https://doi.org/10.1080/17477891.2019.1675578" target="_blank" rel="noopener noreferrer"><em>Emrich et al.</em></a>, 2020], such as the Federal Emergency Management Agency's (FEMA) <a href="https://www.fema.gov/individual-disaster-assistance" target="_blank" rel="noopener noreferrer">Individual Assistance</a> program and the U.S. Department of Housing and Urban Development's Community Development Block Grant (CDBG) <a href="https://www.hudexchange.info/programs/cdbg-dr/" target="_blank" rel="noopener noreferrer">Disaster Recovery</a> program. Both research directions posit social vulnerability indicators as potential measures of social equity.</p>Social Vulnerability as a Measure of Equity
<p>Given their focus on social marginalization and economic barriers, social vulnerability indicators are attracting growing scientific interest as measures of inequity resulting from disasters. Indeed, social vulnerability and inequity are related concepts. Social vulnerability research explores the differential susceptibilities and capacities of disaster-affected populations, whereas social equity analyses tend to focus on population disparities in the allocation of resources for hazard mitigation and disaster recovery. Interventions with an equity focus emphasize full and equal resource access for all people with unmet disaster needs.</p><p>Yet newer studies of inequity in disaster programs have documented troubling disparities in income, race, and home ownership among those who <a href="https://eos.org/articles/equity-concerns-raised-in-federal-flood-property-buyouts" target="_blank">participate in flood buyout programs</a>, are <a href="https://www.eenews.net/stories/1063477407" target="_blank" rel="noopener noreferrer">eligible for postdisaster loans</a>, receive short-term recovery assistance [<a href="https://doi.org/10.1016/j.ijdrr.2020.102010" target="_blank" rel="noopener noreferrer"><em>Drakes et al.</em></a>, 2021], and have <a href="https://www.texastribune.org/2020/08/25/texas-natural-disasters--mental-health/" target="_blank" rel="noopener noreferrer">access to mental health services</a>. For example, a recent analysis of federal flood buyouts found racial privilege to be infused at multiple program stages and geographic scales, resulting in resources that disproportionately benefit whiter and more urban counties and neighborhoods [<a href="https://doi.org/10.1177/2378023120905439" target="_blank" rel="noopener noreferrer"><em>Elliott et al.</em></a>, 2020].</p><p>Investments in disaster risk reduction are largely prioritized on the basis of hazard modeling, historical impacts, and economic risk. Social equity, meanwhile, has been far less integrated into the considerations of public agencies for hazard and disaster management. But this situation may be beginning to shift. Following the adage of "what gets measured gets managed," social equity metrics are increasingly being inserted into disaster management.</p><p>At the national level, FEMA has <a href="https://www.fema.gov/news-release/20200220/fema-releases-affordability-framework-national-flood-insurance-program" target="_blank">developed options</a> to increase the affordability of flood insurance [Federal Emergency Management Agency, 2018]. At the subnational scale, Puerto Rico has integrated social vulnerability into its CDBG Mitigation Action Plan, expanding its considerations of risk beyond only economic factors. At the local level, Harris County, Texas, has begun using social vulnerability indicators alongside traditional measures of flood risk to introduce equity into the prioritization of flood mitigation projects [<a href="https://www.hcfcd.org/Portals/62/Resilience/Bond-Program/Prioritization-Framework/final_prioritization-framework-report_20190827.pdf?ver=2019-09-19-092535-743" target="_blank" rel="noopener noreferrer"><em>Harris County Flood Control District</em></a>, 2019].</p><p>Unfortunately, many existing measures of disaster equity fall short. They may be unidimensional, using single indicators such as income in places where underlying vulnerability processes suggest that a multidimensional measure like racialized poverty (Figure 2) would be more valid. And criteria presumed to be objective and neutral for determining resource allocation, such as economic loss and cost-benefit ratios, prioritize asset value over social equity. For example, following the <a href="http://www.cedar-rapids.org/discover_cedar_rapids/flood_of_2008/2008_flood_facts.php" target="_blank" rel="noopener noreferrer">2008 flooding</a> in Cedar Rapids, Iowa, cost-benefit criteria supported new flood protections for the city's central business district on the east side of the Cedar River but not for vulnerable populations and workforce housing on the west side.</p><p>Furthermore, many equity measures are aspatial or ahistorical, even though the roots of marginalization may lie in systemic and spatially explicit processes that originated long ago like redlining and urban renewal. More research is thus needed to understand which measures are most suitable for which social equity analyses.</p>Challenges for Disaster Equity Analysis
<p>Across studies that quantify, map, and analyze social vulnerability to natural hazards, modelers have faced recurrent measurement challenges, many of which also apply in measuring disaster equity (Table 1). The first is clearly establishing the purpose of an equity analysis by defining characteristics such as the end user and intended use, the type of hazard, and the disaster stage (i.e., mitigation, response, or recovery). Analyses using generalized indicators like the CDC Social Vulnerability Index may be appropriate for identifying broad areas of concern, whereas more detailed analyses are ideal for high-stakes decisions about budget allocations and project prioritization.</p>Wisconsin will end its controversial wolf hunt early after hunters and trappers killed almost 70 percent of the state's quota in the hunt's first 48 hours.
By Jessica Corbett
Sen. Bernie Sanders on Tuesday was the lone progressive to vote against Tom Vilsack reprising his role as secretary of agriculture, citing concerns that progressive advocacy groups have been raising since even before President Joe Biden officially nominated the former Obama administration appointee.