
 568k
568k  233k
233k  41k
41k  Subscribe
What Is Solar Energy & How Does it Work? (2024 Guide)
Here’s what we’ll cover in this guide:
- How solar energy works
- How you can benefit from solar
- How to determine if your home is a good solar candidate
Find local solar quotes
Get Quote
Join the 1,587 homeowners who got free quotes in the past 30 days.
Each product and or company featured here has been independently selected by the writer. You can learn more about our review methodology here. If you make a purchase using the links included, we may earn commission.
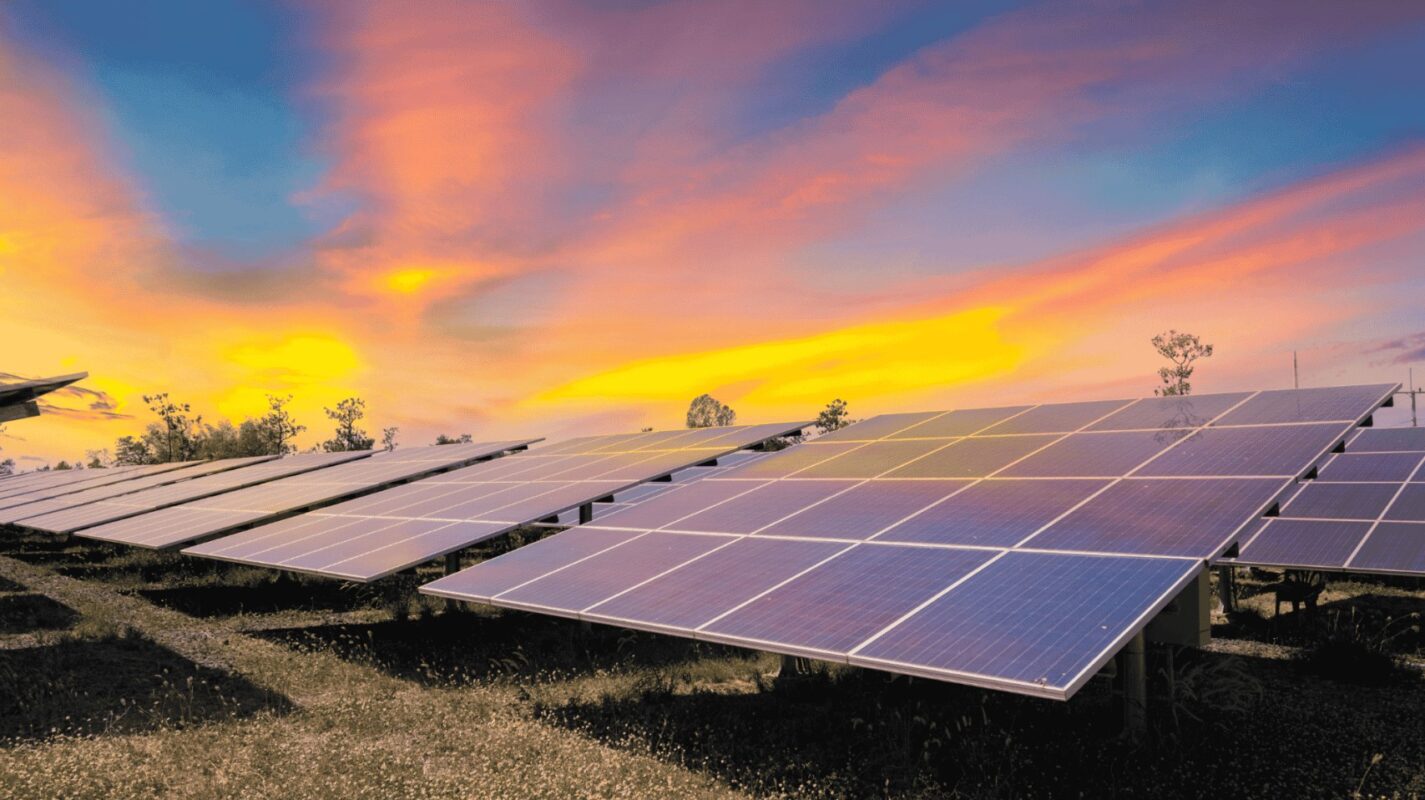
Solar Energy Definition
Let’s begin with a general overview of solar power. The sun provides us with natural light during the day. In doing so, it sends individual particles of sunlight, known as photons, to the Earth. Each photon contains energy, and that energy fuels the Earth in various ways.
It might surprise you to learn that, during any given hour, the Earth receives enough solar energy that it could theoretically fulfill the entire planet’s energy needs for one full year. But where does all this solar power actually come from? Well, keep in mind that the sun is a star, and like any other star, it’s basically one big nuclear reactor.
There are nuclear fusion reactions happening in the sun’s core all the time, producing huge amounts of energy that radiate out into space in the form of light and heat. Large quantities of this solar radiation ultimately reach Earth’s surface. Solar power can be collected via a technology called photovoltaics, then it will change sunlight directly into electricity that can be used to supply power to a home or a business. Generally, solar power works by converting energy from the sun into power.
Solar energy currently represents a relatively small fragment of the global energy economy, yet it’s gaining in popularity, largely thanks to the falling prices of solar panel installation, combined with a growing desire among homeowners to reduce their utility bills and their carbon footprints.

SunPower
Best National Provider
Nationwide Service
Average cost
Pros
- Most efficient panels on the market
- National coverage
- Cradle to Cradle sustainability certification
- Great warranty coverage
Cons
- Expensive
- Customer service varies by local dealer
SunPower designs and installs industry-leading residential solar and storage solutions across all 50 states. With a storied history of innovation dating back to 1985, no other company on this list can match SunPower’s experience and expertise.
SunPower earns its position as the top national installer on our list for a handful of reasons: It installs the most efficient solar technology on the residential market, offers the most expansive service area and backs its installations with a warranty well above the industry standard. All the while, SunPower pioneers sustainability efforts within the industry.
If that weren’t enough, SunPower systems come packaged with products all manufactured in-house by its sister company, Maxeon. This means that your panels, solar cells, inverters, battery and EV chargers are designed to work together and are all covered under the same warranty.
SunPower’s biggest downside? Its high-efficiency panels are considerably more expensive than most of its competitors’ products. However, its powerful panels are workhorses that make up for the initial cost with more backend production (think about this like spending more money for a car that gets more miles per gallon).
Facts and Figures: SunPower
| EcoWatch Rating |
|---|
| Better Business Bureau (BBB) Rating |
| Year Founded |
| Average Cost ($-$$$$$) |
| Solar Services |
| Brands of Solar Equipment Offered |
| Warranty Coverage |
| 5 |
| A+ |
| 1985 |
| $$$$ |
| Solar Panels, Solar Batteries, EV Chargers, System Monitoring |
| SunPower Panels |
| 25-year all-inclusive warranty |
Blue Raven Solar
Best Solar Financing
Regional Service
Average cost
Pros
- Industry-leading in-house financing
- Competitive pricing
- Excellent reputation
Cons
- Doesn't offer solar batteries (coming 2022)
We like Blue Raven Solar because it understands that, for most homeowners, the cost of solar presents the biggest barrier to entry.
For that reason, Blue Raven Solar developed an innovative solar financing plan that offers in-house, flexible, zero-money-down options. The results speak for themselves, as Blue Raven Solar is now one of the fastest-growing solar companies in the nation and was recently acquired by SunPower. Its BluePower Plus+ plan (exclusive to Blue Raven) mimics the flexible structure of a lease while still providing the greatest benefits of owning your system.
Eligible homeowners enjoy 18 months of solar power before having to pay their first bill. When coupled with the federal solar investment tax credit (ITC), the initial energy savings can offset more than a third of the overall cost of a system before requiring a dollar down.
In contrast, other installers can only offer similar financing through solar leases, PPAs or third-party providers (such as Mosaic or Sunlight). Third-party loan providers can complicate the process, while opting for a loan or PPA will disqualify you from some of solar’s biggest benefits (additional property value, federal solar tax credit and local solar incentives).
Facts and Figures: Blue Raven Solar
| EcoWatch Rating |
|---|
| Better Business Bureau (BBB) Rating |
| Year Founded |
| Average Cost ($-$$$$$) |
| Solar Services |
| Brands of Solar Equipment Offered |
| Warranty Coverage |
| 4.5 |
| A+ |
| 2014 |
| $$ |
| Solar Panels, System Monitoring |
| Trina Solar, Canadian Solar, SolarEdge, Silfab, SunPower |
| 25-year manufacturer warranty; 10-year workmanship warranty, 2-year production guarantee |
Using Solar Power
Now let’s take a closer look at solar technologies and the process of harvesting and using energy from the sun. We already mentioned photovoltaics, which represents the most common method of harvesting solar energy. This approach is generally used for small-scale applications, such as portable solar generators or residential solar systems.
Another option, called solar thermal capture, is typically better suited to produce solar electricity on a larger scale. Here’s a quick breakdown of these two basic options for harvesting solar energy.
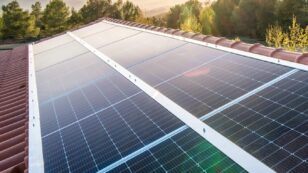
Harvesting Energy With Photovoltaics
This is the method you’re more likely to be familiar with, as it describes the way solar energy is harvested in residential settings. By installing solar energy systems made with photovoltaic cells, or PV cells, homeowners can collect energy from the sun, using solar panels positioned on their roofs that convert sunlight into energy.
An inverter turns that solar energy into an electrical current, which can be used to power household systems, appliances and connected devices. With some photovoltaic systems, any surplus electricity is funneled back into the power grid, resulting in a credit from the utility company; in turn, if the PV system does not create enough solar electricity to power the home, the homeowner may draw power from the main utility grid.
By contrast, some PV systems come equipped with a solar panel battery bank, which means surplus energy can be stored and used at a later date. There are a few types of solar panels, but most residential ones use what’s known as the photovoltaic effect. This process allows them to convert raw solar power into usable energy. Here’s a rough breakdown of how solar panels work:
- The sun’s rays hit a semiconductor within a solar panel (usually made of silicon), which releases electrons. These electrons move through a conductor to produce an electric current.
- The current produced by these wires is known as direct current, or DC; your house requires alternating current, or AC electricity. A component known as a solar inverter turns the DC power into AC power.
- AC power is then fed into the primary circuit board, meaning it can power any of the outlets or connected appliances in the home. Surplus solar electricity may be stored in a battery to be used when the sun isn’t shining directly on the panels.
This is a basic description of how solar electricity works in a residential setting, enabling homeowners to control their electricity generation. The benefit is that you can reduce or even eliminate your reliance on utility companies, and thus, your monthly utility bills. Even more impactful, it allows you to lessen your reliance on fossil fuels and municipal power plants, which cuts down on environmental pollution.
But first, if you’re interested in speaking with a solar company to have solar installed on your house, click one of the buttons below to be connected for a free quote.
Harvesting Energy With Solar Thermal
Another option for harvesting solar energy is to directly capture heat from the sun’s radiation. The solar thermal method actually has a much broader range of uses than the photovoltaic process. With that said, it’s not nearly as practical or as feasible to use the solar thermal method on a small scale, which is why residential solar systems use the PV method. There are three main kinds of solar thermal energy used in industry:
- Low-temperature solar thermal energy is used to heat and cool the air.
- Mid-temperature is used specifically for heating water.
- High-temperature is used for generating electrical power.
So, to flesh those out a bit more: Low-temperature solar thermal methods are primarily used to heat or to cool the air, as a means of climate control like space heating or air conditioning.
Mid-temperature solar thermal methods capture the sun’s energy and transfer it to pipes, heating the water those pipes contain.
High-temperature solar thermal is used to generate electricity on a larger scale, such as in an electrical plant. This process actually revolves around a series of mirrors, which are positioned to catch the sunlight and reflect it onto a series of tubes.
These tubes contain liquids that are effective in capturing and holding heat energy. This heated liquid is then used to turn water into steam, turning turbines to produce electrical power. You can understand why this complex system is not a feasible option for individual homes, but it represents a very promising renewable energy source for large-scale use.
Learn More About Best Solar Panels by Watt
Using Solar Energy in Your Home
Now that we’ve exhausted the solar energy definition, let’s turn toward practical questions: Are solar panels worth it for your home? Let’s go through some solar energy pros and cons.
Installing a Solar Power System Offers Immense Benefits
There are certainly a number of benefits to solar power, including:
- Solar energy use can allow you to reduce your monthly electric bills and, in some cases, eliminate those bills completely. This produces big cost savings over time.
- Solar power is a clean, renewable energy source, meaning you won’t be contributing to direct pollution (unlike with oil or coal) and greenhouse gas emissions.
- When you buy solar panels, there are a number of tax incentives and rebates available to offset startup costs, including some available at the federal level and some that are state-specific.
- Most residential solar systems will produce electricity for 20 to 30 years and require very little maintenance.
There Can Also Be Drawbacks
Solar power boasts numerous advantages, but that doesn’t mean it’s perfect. Some of the most significant downsides include:
- The initial cost of going solar is fairly extensive, averaging out to around $13,900, and in some cases topping $27,500. Tax incentives and monthly utility savings can offset this cost, but even still, going solar always requires a big investment on the front end.
- Some homes just aren’t suited for solar. If you don’t get enough exposure to the sun, then a home solar system may not work out.
- If you live in an area where electricity is inexpensive, then the savings you get from a solar system will be comparatively small.
Is My Home Suitable for a Residential Solar System?
The best way to determine whether your home is a good fit for solar electricity is to contact one of the top solar companies in your area. A solar panel installation specialist can come take a look at your home and give you an individualized recommendation.
Solar energy is best suited for those who live in sunny areas; who have plenty of surface area on their roof; and who don’t have to worry about shading from nearby trees, buildings or other obstructions.
What to Look for in a Home Solar System
As you shop around for home solar systems, make sure to keep the following factors in mind:
- The efficiency of your solar panels, or how much sunlight they actually turn into electricity (the most efficient solar panels convert over 20%).
- The capacity of your solar battery.
- Warranties and other protections for your home solar system.
- The total number of panels you need to get the desired results.
- The services offered by your solar installer (such as individual system design).
Are You Ready to Embrace Solar Power?
For anyone seeking a clean and efficient energy solution, solar electricity may be the best bet. If you’re ready to continue your education, we recommend checking out some demos of specific solar panels, or connecting with a local installer to get a solar energy quote.
Learn About Solar Incentives in Your State
You can do that right now by clicking one of the buttons below:
FAQ: What is Solar Energy?
Solar energy, in simple words, is the light and heat radiated by the sun. Here on Earth, we can collect that solar energy with solar panels and convert it into electricity we can use to power our homes.
Five advantages of solar energy include:
- It’s a truly renewable energy source that directly offsets carbon emissions and air pollution.
- It helps homeowners save money on power bills.
- There are low maintenance costs for homeowners.
- Solar can be used in remote applications to power homes or shelters that aren’t connected to an energy grid.
- Solar panel manufacturing and installation creates thousands of green jobs per year.
Here’s how we would explain solar energy to a child: You know how when you step into the sun, you feel hot? That heat is a form of energy. Solar panels are a way of catching that energy, and using it to power your home.
Solar energy is definitely considered a growing industry both for residential and commercial use. According to the SEI solar energy represented 39 percent of new electricity capacity in the first half of 2022.


Comparing authorized solar partners
Average cost
Pros
Cons
BBB Rating
Year founded
Service Area
Brands of Solar Equipment Offered
Warranty Coverage
-
- Most efficient panels on the market
- National coverage
- Cradle to Cradle sustainability certification
- Great warranty coverage
- Expensive
- Customer service varies by local dealer
A+Best National Provider1985SunPower Panels25-year all-inclusive warranty
Having trouble deciding? Click below and use our process to receive multiple quotes instead: