
 568k
568k  233k
233k  41k
41k  Subscribe

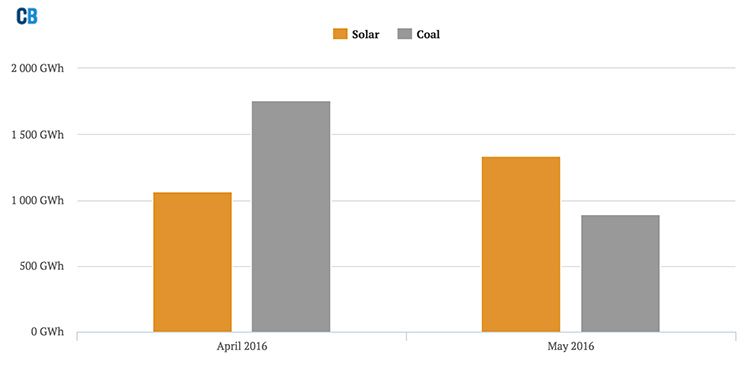
The UK’s solar panels generated more electricity than coal in May 2016, the first-ever calendar month to pass the milestone, Carbon Brief analysis shows.
Solar generated an estimated 1,336 gigawatt hours (GWh) of electricity in May, 50 percent more than the 893 GWh output from coal. The finding follows on from Carbon Brief’s earlier analysis showing solar beating coal for the first full day on April 9 and for the first week from May 3.

While these milestones are largely symbolic, they do highlight the major changes going on in the UK electricity system. For further context, analysis and data details see the previous coverage from Carbon Brief.
UK Monthly Electricity from Solar and Coal
The chart below shows that solar generated 50 percent more electricity than coal during May 2016. This was due to a combination of low coal output and the impact of longer days as summer approaches.
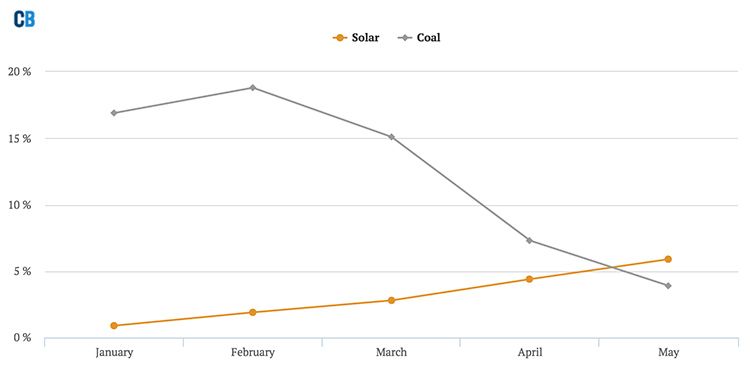
Solar and Coal Shares of UK Total
Solar generated nearly 6 percent of the UK’s electricity needs during May, against less than 4 percent for coal (see note below for details of this calculations). In January, the figures were just 1 percent for solar and 17 percent for coal.
There has been a huge reduction in coal-fired power generation in the UK since the start of 2016, as the chart below shows. Nearly a quarter of electricity generation in 2015 was from coal but since the, power market economics have shifted in favor of gas and several coal plants have opted to close.
UK Weekly Electricity From Solar and Coal
Solar has generated more electricity than coal in each of the past five weeks. Note that coal generation increased around the start of June as a result of low wind power output.
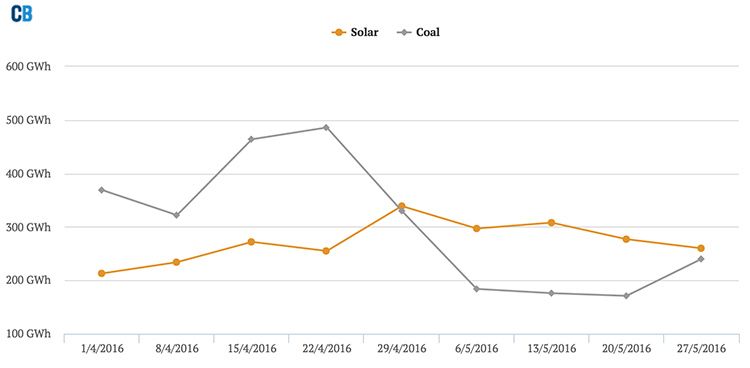
UK Daily Electricity From Solar and Coal
Although solar has cumulatively outpaced coal in each week since the end of April, coal has topped solar on some days in May, as the chart below shows.
The UK passed a historic milestone in mid-May as coal output hit zero on seven periods across the week commencing Monday, May 9. Total daily coal output was near zero during May 12-14. The zero-coal periods were reported by the Financial Times, the Press Association, the Telegraph and others, citing Carbon Brief analysis.

Notes: The figures for shares of total UK electricity generation are estimates. They only include solar generation and other forms of generation that are connected to the transmission grid network. Embedded generation from wind or other sources is not centrally metered and data is not available. However, this missing data will not alter the relative positions of solar and coal generation.
Figures for solar output in the UK are estimates produced by Sheffield Solar. The project recently updated its estimates of installed UK solar capacity.
YOU MIGHT ALSO LIKE
228 Cities Around the World Take the Lead on Climate Action
South Korea’s Plan to Have World’s First Carbon-Free Island
100 Solutions to the World’s Most Pressing Challenges
Cleveland Soon to Be Home to the Nation’s First Offshore Wind Farm in Fresh Water