
 568k
568k  233k
233k  41k
41k  Subscribe
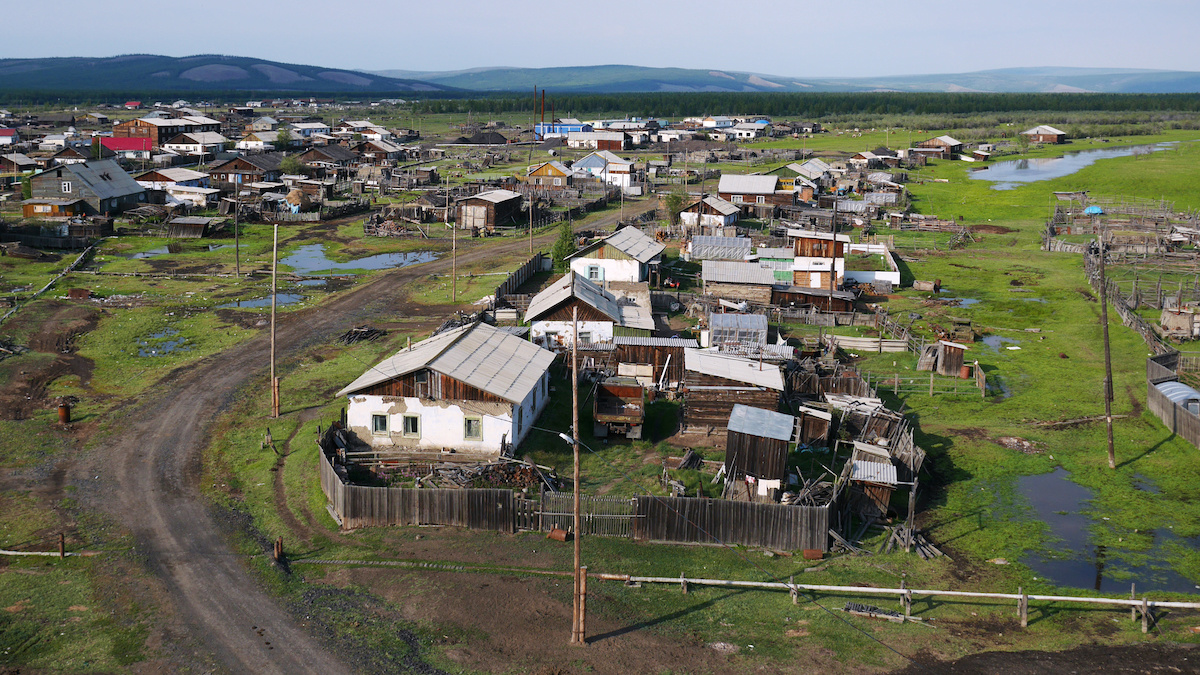
The town of Verkhoyansk in Siberia has just recorded a temperature of 100.4 degrees Fahrenheit. Amos Chapple / Lonely Planet Images / Getty Images Plus
A town in Siberia recorded a temperature of 38 degrees Celsius, or 100.4 degrees Fahrenheit Saturday.
If verified, it will break the record both for the town itself and for everywhere north of the Arctic Circle, The Weather Channel reported. It also comes as Siberia has experienced an exceptionally warm 2020 so far.
“What’s happening in Siberia this year is nothing short of remarkable. The kind of weather we expect by 2100, 80 years early,” CBS meteorologist Jeff Berardelli tweeted.
Likely the hottest temperature ever recorded in the Arctic happened today-100.4 F- What's happening in Siberia this year is nothing short of remarkable. The kind of weather we expect by 2100, 80 years early.
For perspective Miami has only reached 100 degrees once on record. https://t.co/WDPRmLRD4d— Jeff Berardelli (@WeatherProf) June 20, 2020
The town of Verkhoyansk, where the high temperature was recorded, is usually one of the coldest places on Earth, Berardelli wrote for CBS.
Its average high temperature for late June is in the high 60s, according to The Weather Channel, and its previous record high temperature was 99.1 degrees Fahrenheit, set in 1988. In November 2019, its temperature plunged to almost 60 degrees below zero, Vox reported. On Sunday, children were photographed seeking relief in a lake that is frozen in winter, according to The Weather Channel.
Verkhoyansk’s record cold temperature was set at negative 67.8 degrees Celsius, or negative 90 degrees Fahrenheit, in 1892. If Saturday’s reading holds, that will put a 105.8 degrees Celsius difference between the town’s temperature extremes.
“That’s a difference in extremes larger than the difference between water’s freezing and boiling points, likely the largest spread between all-time record high and low temperatures anywhere on Earth,” Jonathan Erdman wrote for The Weather Channel.
There are some doubts about the accuracy of Saturday’s reading, according a Washington Post article reported by Vox. But a weather balloon recorded unusually high temperatures in the lower atmosphere Saturday, and the town hit 95.3 degrees on Sunday.
Even if the reading doesn’t hold, Siberia is still in the grips of an extremely warm 2020.
Temperatures in May were 10 degrees Celsius higher than usual, making it the region’s warmest May on record, according to the Copernicus Climate Change Service.
Unusual events in Siberia have been in the news. In fact, our May temperature summary showed higher than average temps over wide areas, by as much as 10°C.
We used #CopernicusClimate Change Service's resources to take a closer look at what's happening➡️https://t.co/bHPpQbPLzc pic.twitter.com/NaSNY2d9Ux
— Copernicus ECMWF (@CopernicusECMWF) June 12, 2020
And Russia broke its record for January to May 2020 by more than 1.9 degrees Celsius, according to Berkeley Earth lead scientist Robert Rohde.
“It is undoubtedly an alarming sign, but not only May was unusually warm in this region,” senior Copernicus Climate Change Service scientist Freja Vamborg said in a statement reported by Vox. “The whole of winter and spring had repeated periods of higher-than-average surface air temperatures.”
All of this heat has had real consequences, Rohde pointed out.
Siberia has seen early, widespread wildfires, and melting permafrost contributed to a devastating oil spill when it caused pillars beneath a storage tank to sink.
Siberia’s current heat wave has both a short- and long-term cause, Beradelli explained.
In the short term, the heat wave is the result of a high pressure dome, but ultimately the climate crisis is driving Arctic extremes.
“Due to heat trapping greenhouse gases that result from the burning of fossil fuels and feedback loops, the Arctic is warming at more than two times the average rate of the globe,” he wrote.
Correction: An earlier version of this article said that the average temperature in Verkhoyansk for late June was in the mid 60s, but its average high for this period is in the high 60s.
- Researchers Warn Arctic Has Entered 'Unprecedented State' That ...
- Coronavirus Threat Delays Arctic Climate Researchers - EcoWatch
- Wildfires Are Burning 5 Million Acres in Siberia and Eastern Russia ...
- Releasing Animals Into the Arctic Could Fight Climate Change ...
- Siberian Heat Wave Was Made 600x More Likely by the Climate Crisis, Scientists Say - EcoWatch
- Reindeer and Their Nomadic Herders Face Climate Change - EcoWatch
- Vicious Climate Cycle in Russia Is Melting Permafrost, Releasing Methane and Fueling Wildfires - EcoWatch