
 568k
568k  233k
233k  41k
41k  Subscribe
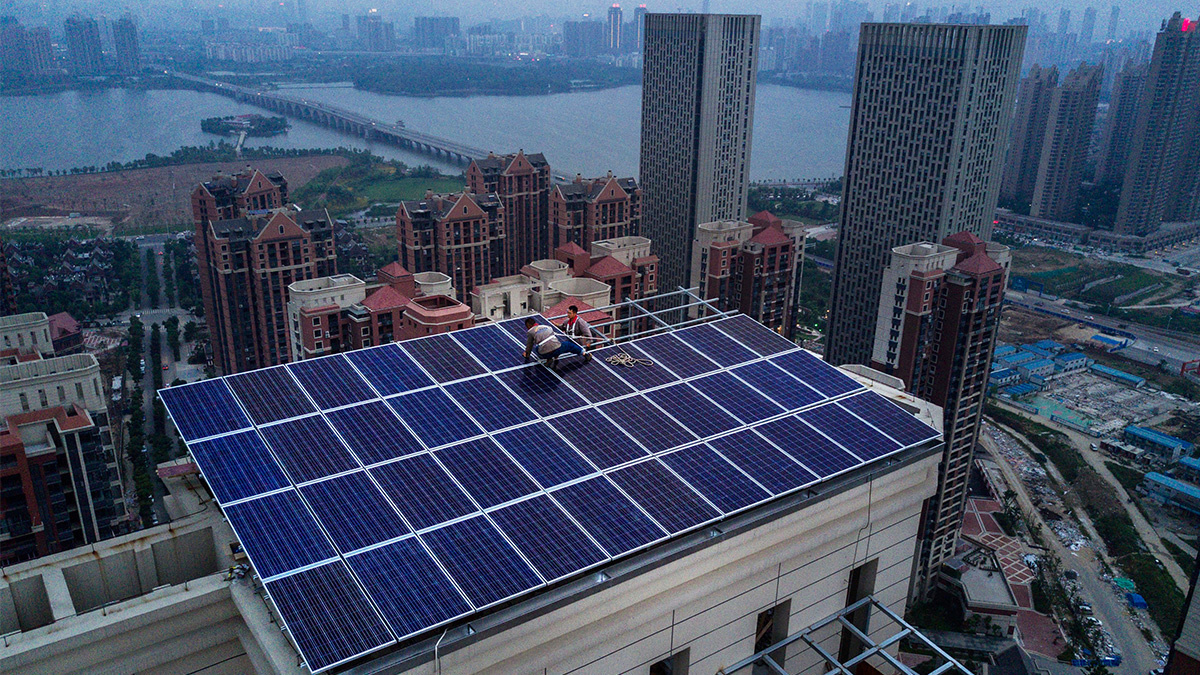
Workers attend to a rooftop solar panel project on May 14, 2017 in Wuhan, China. Kevin Frayer / Getty Images
By Simon Evans
Renewable sources of electricity are set for rapid growth over the next five years, which could see them match the output of the world’s coal-fired power stations for the first time ever.
This would mean renewables matching coal as the joint-largest contributors to the global electricity mix in 2024, according to Carbon Brief analysis of new forecasts in the International Energy Agency (IEA) Renewables 2019 report.
The analysis is based on the IEA’s “accelerated case,” in which the combined capacity of hydro, wind, solar and biomass increases by more than 60% over the next five years. Even in its “base case,” renewable capacity is set to expand by nearly 50%, the IEA forecasts.
Dr. Fatih Birol, IEA executive director, writes in a foreword to the report that “thanks to falling costs, technologies such as solar photovoltaics (PV) and wind are at the heart of transformations taking place across the global energy system.” He adds: “Their increasing deployment is crucial for efforts to tackle greenhouse gas emissions, reduce air pollution and expand energy access.”
The IEA’s base-case renewable forecasts have historically underestimated the pace of growth. Yet even in its accelerated case, the extra electricity from renewable sources will fail to keep up with rising overall demand, the IEA forecasts suggest.
This means that generation from fossil fuels would also have to increase, along with the electricity sector’s CO2 emissions, rather than falling rapidly as required to meet global climate goals.
Rapid Growth
In its base case, the newly published 2019 IEA report forecasts that global renewable energy capacity will increase by close to 50% in the five years to 2024, as the chart below shows (red line).
This would mean global hydro, wind, solar and biomass capacity rising from 2,501 gigawatts (GW) in 2018 to 3,721GW in 2024. The increase of 1,220GW means the world would be building renewable capacity equal to the entire U.S. electricity system today, says the IEA.
Within the base case total, wind and solar capacity would nearly double, contributing around 85% of the increase for all renewables, with hydro accounting for another tenth and bioenergy 4%.
It is worth noting, however, that the IEA’s base-case has historically underestimated the pace of growth, as the chart above shows. As a result, successive forecasts have been revised upwards in light of increasingly favorable policy conditions and faster-than-expected reductions in cost.
In a series of auctions tracked by the IEA, the cost of solar has fallen from 0 per megawatt hour (MWh) in 2014 to an average of /MWh for projects due to start operating in 2023, while for onshore wind the costs have fallen from /MWh in 2014 to /MWh for 2023.
The IEA has also included an “accelerated case” in its 2019 forecasts, shown with a dashed line in the chart, above. In this case, renewable capacity would increase by more than 60% to 4,036GW in 2024, adding 1,535GW in five years, equivalent to the current total fleets of the U.S. and Japan.
This is not the first time that the IEA has hedged its view for the next five years.
Back in 2016, for example, the agency’s base case forecast some 826GW of renewable capacity being added by 2021, with an accelerated case adding 1,061GW. This accelerated case from 2016 aligns closely with the 2019 base case, which has 1,096GW being added during 2016-2021.
Bottom Up
The IEA forecast is based on detailed bottom-up analysis of the market, policy and electricity system outlook in each of 41 individual countries and every world region.
Capacity growth is expected to be concentrated in just a handful of regions, the IEA says, with 40% in China, 17% in Europe, 11% in the U.S. and 9% in India. Together, these account for four-fifths of the global increase in the IEA’s base case.
As already mentioned, renewable capacity has consistently oustripped the growth expected in the IEA base case, which has tended to suggest that annual additions will remain at a similar level into the future, rather than consistently rising year on year.
The amount of new renewable capacity built around the world, each year since 2006, is shown in red in the chart below, while successive base-case forecasts are shown in shades of blue.
As in previous years, the IEA has once again raised its forecast growth over the next five years, adding 14% to the amount of new capacity that it expects to be built. Last year, it forecast growth of 1,070GW over the five years to 2023. Now, it is forecasting 1,220GW in the five years to 2024.
Responding to a question from Carbon Brief, Heymi Bahar, IEA senior renewable energy analyst and a lead author of the report told a pre-publication press call that this upwards revision was due to a roughly 50/50 combination of more favorable policy and lower costs.
On the policy side, Bahar pointed to a series of additional renewables auctions in the EU, initiated as countries look to meet their 2020 targets and as the bloc’s 2030 goals have been firmed up. In China, grid expansion and market reforms have reduced the amount of renewable electricity that is “curtailed” – generation that is wasted due to insufficient grid capacity or an excess of supply.
The flattening of renewable capacity growth during 2018, seen in the red line in the chart, above, was also largely down to changes in China. This stalling marked the first time in two decades when the amount of renewable capacity built each year failed to exceed that seen before.
During 2018, China started to shift decisively away from support based on “feed-in tariffs” that pay renewables a fixed price for each unit of electricity generated and towards a system of competitive auctions awarding a fixed pot of money or capacity to the lowest bidders.
This seismic change in the policy landscape of the world’s largest market for renewable energy had been widely expected to dent global growth, including in last year’s IEA report. Yet as this year’s figures show, despite a small dip in China itself, the global picture was buoyed by strong growth in other markets, keeping growth steady overall, rather than the expected decline.
Number One
The pace of expansion in renewable capacity has already dented the prospects of fossil-fueled sources of electricity in many countries, eating into their market share and changing the way wholesale prices vary across days, months and seasons.
Nevertheless, the growth of global electricity demand has been such that generation from fossil-fuel sources has continued to rise, increasing the sector’s contribution to CO2 emissions. Moreover, coal has comfortably maintained its position as the world’s largest source of electricity.
IEA executive director Dr. Birol says in a press release:
“Renewables are already the world’s second largest source of electricity, but their deployment still needs to accelerate if we are to achieve long-term climate, air quality and energy access goals.”
Since 2010, global supplies of renewable electricity have expanded by 60%, adding enough output to power half the U.S. economy. Yet this growth was only sufficient to cover half of the increase in global electricity demand, with the other half coming from a roughly equal split of coal and gas.
Over the next five years, the IEA base case forecasts that renewables will meet a larger two-thirds share of the increase in global demand. This would mean a continuing, if somewhat diminished role for coal and gas in meeting rising demand, with extra CO2 emissions to match.
Since the majority of demand growth would be met by renewables, they would claim an increasingly large share of the global electricity mix. In the base case, renewables (red line and dots) would increase their share from 25% today to 30% in 2024, gaining five percentage points in five years. This would largely come at the expense of coal (black), which would drop to 34% of the mix, but would remain the biggest contributor to global electricity supplies.
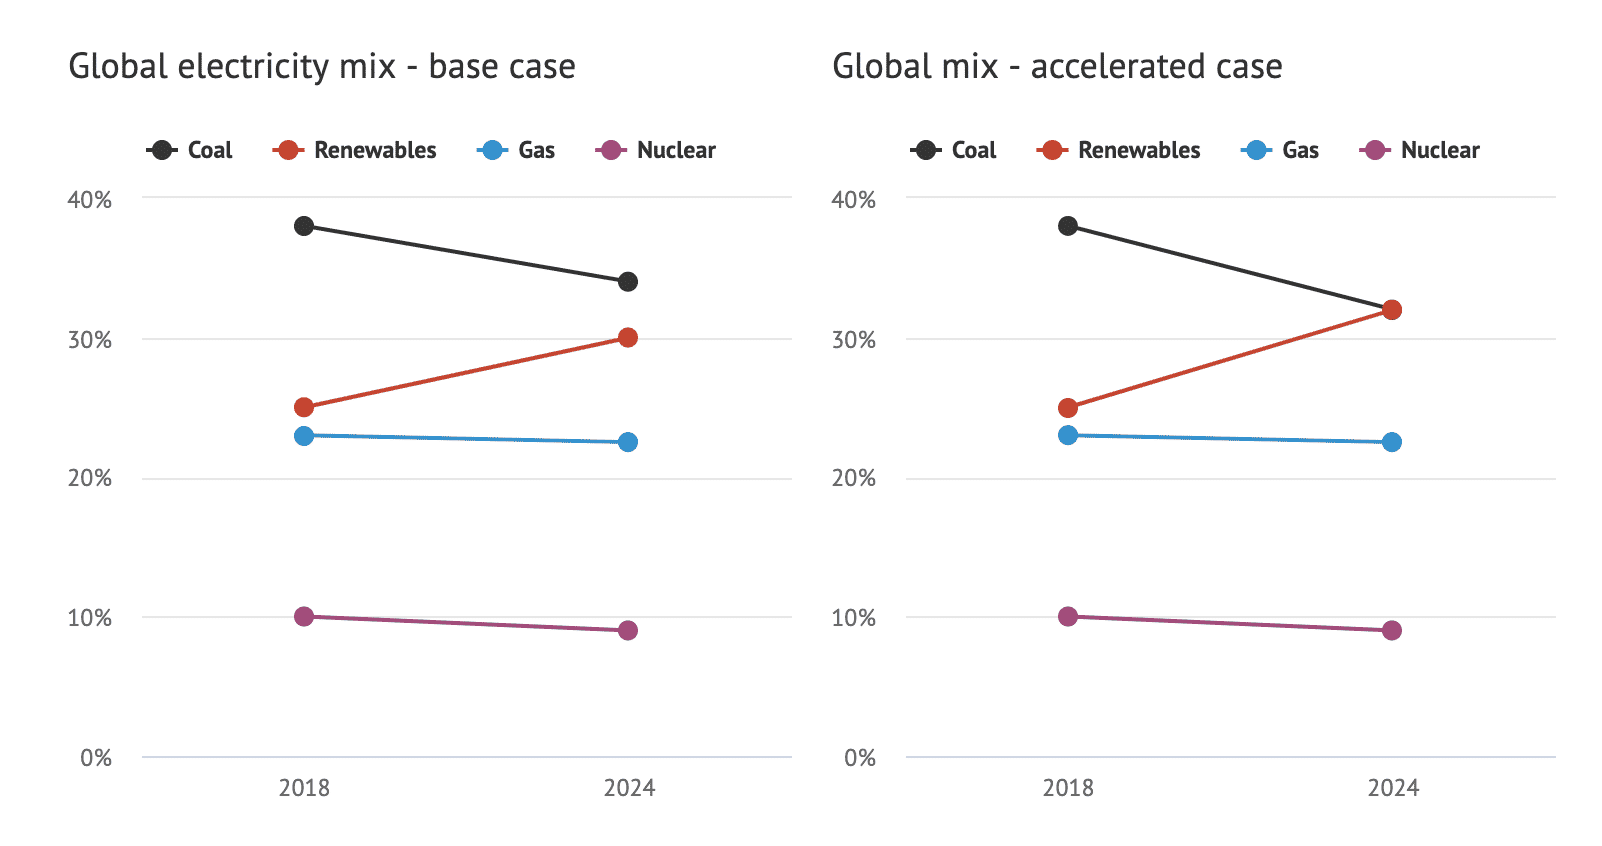
Change in the share of global electricity generation accounted for by coal (black lines), renewables (red), gas (blue) and nuclear (purple) between 2018 and 2024. The IEA base case is shown on the left while Carbon Brief’s estimate of the mix in the IEA accelerated case is on the right. Source: IEA Renewables 2019 report and Carbon Brief analysis. Chart by Carbon Brief using Highcharts.
Given the increase in demand overall, gas in particular, but also coal, would see their output – and emissions – increasing over the next five years in the IEA base case, despite losing market share.
The IEA’s report does not include equivalent figures for its “accelerated case,” where renewables grow more quickly than expected. However, Carbon Brief analysis of the IEA’s capacity forecasts suggests it could mean renewables matching coal as the world’s joint-largest sources of electricity.
This is shown in the chart, above right, where the renewable share of global electricity supplies would reach 32% by 2024 and coal would fall to a similar level. But even in this accelerated case, renewables would meet only 80% of the increase in demand, with gas making up the remainder.
This accelerated case for renewables could mean coal output flattening or even starting to decline out to 2024, but not at the rate required to get onto a pathway compatible with global climate goals.
As in previous years, the IEA sets out three areas that would need to be addressed in order for the accelerated case to be realized. These are: policy and regulatory uncertainty; high investment risks in developing countries; and managing the integration of variable renewables into existing grids.
(The IEA notes that in the early stages of wind and solar deployment curves in each country or region, “integration challenges are often not as serious as anticipated.”)
The integration issue is a particular concern for “distributed” solar, the IEA suggests. This includes residential rooftops, but also larger commercial and industrial rooftop systems, which tend to have lower costs, the IEA says.
Given costs for these systems are now at or below the price of retail electricity in most countries – with costs set to fall a further 15-35% by 204 – there is an “explosive cocktail” of ingredients is in place for a “boom” in distributed solar capacity, Paolo Frankl, head of the IEA’s renewable energy division told a pre-publication press call.
Dr. Birol told the call that this sector had “breathtaking” potential, but would need to be carefully managed so as to balance the interests of distributed solar owners, other consumers and the companies that manage electricity grids.
Reposted with permission from our media associate Carbon Brief.
- The So-Called Political Divide on Coal vs. Renewables Is Fake News
- U.S. Renewable Energy Capacity Beats Coal for the First Time ...
- Britain Just Went Nearly Three Weeks Without Coal, a New Record ...