
 568k
568k  233k
233k  41k
41k  Subscribe
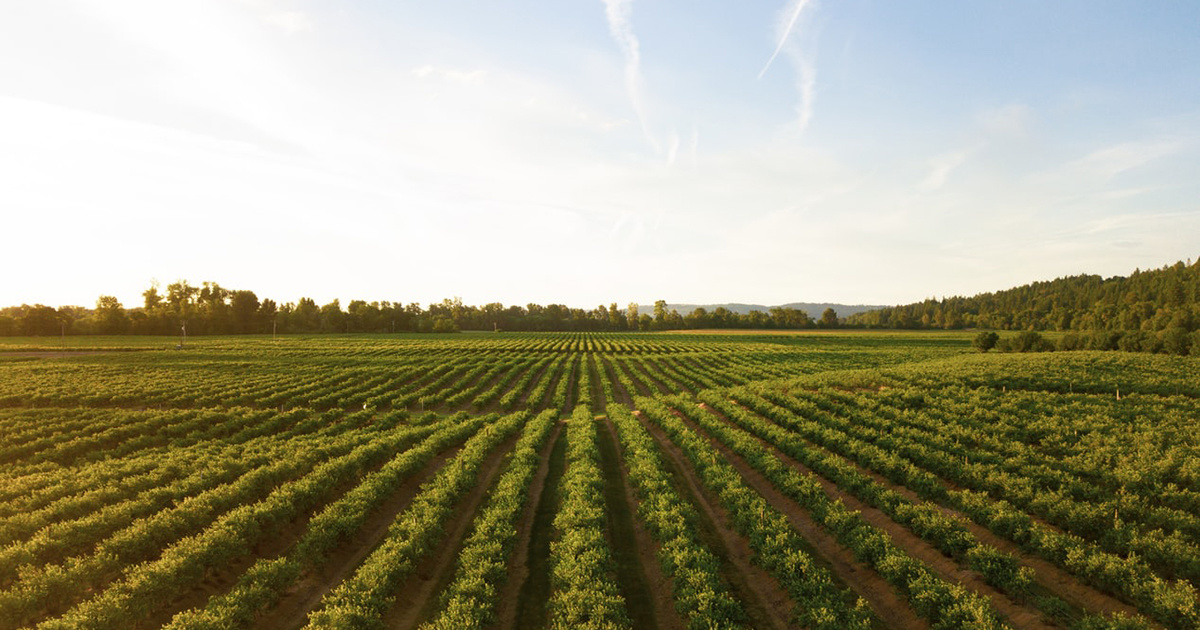
Unsplash
In addition to a long list of incredible benefits for farmers and their crops, regenerative agriculture practices help us fight the climate crisis by pulling carbon from the atmosphere and sequestering it in the ground.
We know that to solve the climate crisis, business as usual will not cut it. Not in electricity production. Not in industry. Not in transportation. And certainly not in agriculture.
The agriculture sector is one of the biggest emitters of CO2, the greenhouse gas (GHG) most responsible for the changes we are seeing in our climate today. Together with forestry and other land use, agriculture is responsible for just under 25 percent of all human-created GHG emissions.
But it also has a vital role to play in helping us end this crisis, and create a safe, sustainable future without carbon pollution. One where we can provide our booming world population with fresh, healthy food grown in a sustainable soil ecosystem.
Sure, it may seem like a contradiction. So don’t take it from us – take it from the Intergovernmental Panel on Climate Change (IPCC): “Leveraging the mitigation potential in the [Agriculture, Forestry and Other Land Use] sector is extremely important in meeting emission reduction targets.”
But how?
We’ve got two words for you: regenerative agriculture.
How it Works
In short, regenerative agriculture is a system of farming principles and practices that seeks to rehabilitate and enhance the entire ecosystem of the farm by placing a heavy premium on soil health with attention also paid to water management, fertilizer use, and more. It is a method of farming that “improves the resources it uses, rather than destroying or depleting them,” according to the Rodale Institute.
A great deal of emphasis is placed on looking holistically at the agro-ecosystem. Key techniques include:
- Conservation tillage: Plowing and tillage dramatically erode soil and release large amounts of carbon dioxide into the atmosphere. They also can result in the kind of bare or compacted soil that creates a hostile environment for important soil microbes. By adopting low- or no-till practices, farmers minimize physical disturbance of the soil, and over time increase levels of soil organic matter, creating healthier, more resilient environments for plants to thrive, as well as keeping more and more carbon where it belongs.
- Diversity: Different plants release different carbohydrates (sugars) through their roots, and various microbes feed on these carbs and return all sorts of different nutrients back to the plant and the soil. By increasing the plant diversity of their fields, farmers help create the rich, varied, and nutrient-dense soils that lead to more productive yields.
- Rotation and cover crops: Left exposed to the elements, soil will erode and the nutrients necessary for successful plant growth will either dry out or quite literally wash away. At the same time, planting the same plants in the same location can lead to a buildup of some nutrients and a lack of others. But by rotating crops and deploying cover crops strategically, farms and gardens can infuse soils with more and more (and more diverse) soil organic matter, often while avoiding disease and pest problems naturally. Always remember, bare soil is bad soil.
- Mess with it less: In addition to minimizing physical disturbance, regenerative agriculture practitioners also often seek to be cautious about chemical or biological activities that also can damage long-term soil health. Misapplication of fertilizers and other soil amendments can disrupt the natural relationship between microorganisms and plant roots.
The overriding theme: If you take care of your soil, it will take care of you.
According to Kiss the Ground, a nonprofit organization devoted to sustainable farming practices that improve soil health, “If regenerative means: ‘renewal, restoration, and growth of cells, organisms, and ecosystems,’ or ‘renewal or restoration of a body, bodily part, or biological system (as in a forest) after injury or as a normal process,’ then regenerative agriculture is agriculture that is doing just that.”
The benefits of doing so are numerous: Regenerative agriculture practices increase soil biodiversity and organic matter, leading to more resilient soils that can better withstand climate change impacts like flooding and drought. Healthy soils beget strong yields and nutrient-rich crops. It also diminishes erosion and runoff, leading to improved water quality on and off the farm.
Importantly, regenerative agriculture practices also help us fight the climate crisis by pulling carbon from the atmosphere and sequestering it in the ground. (More on that below.)
The Climate Connection
The health and vitality of soil everywhere, from the smallest backyard garden to the largest Midwestern farm, plays an integral role in food production — and it’s threatened by the climate crisis.
In addition to rising temperatures that are themselves changing where and how things can be grown, the climate crisis has fundamentally altered the water cycle around the world. The result is shifting precipitation patterns and increased evaporation that causes more-frequent powerful rainfall events and more severe droughts. In many areas, rainfall has become either increasingly abundant or in desperately short supply, relative to longtime averages. It’s a classic case of feast or famine.
Extreme downpours can lead to polluted runoff and erosion because the ground simply isn’t able to absorb the precipitation at the rate it’s falling. And at a certain point of inundation, plants can drown. On the other end of the spectrum, less stable precipitation together with increased heat is causing more and more drought, and in extreme circumstances near-desertification, leading to a complete loss of farm production in some areas.
So, when it comes to agriculture, climate change is doing what it does best: exacerbating existing problems to the point of crisis. But if a farmer is using regenerative methods and not disturbing the soil, he or she is instead mitigating climate change effects by building organic matter. And the more organic matter you have in the soil, the more water-holding capacity you have.
Not only does adopting regenerative agriculture practices help farmers deal with current climate change impacts by making their farms more resilient and adaptive to what is happening around them now; it allows them to take action to fight it long-term by being part of a larger solution to the crisis, through carbon sequestration.
Farms Are Making the Switch
Regenerative agriculture allows farmers to play an active role in mitigating an existential threat to their livelihoods.
“We don’t have to wait for technological wizardry: regenerative organic agriculture can substantially mitigate climate change now,” Rodale Institute writes.
When plants photosynthesize, they take carbon dioxide from the air and — using the sun’s energy, water, and nutrients from the soil — transform it into carbon the plant uses to grow leaves, stems, and roots. The excess carbon created through this process is transported down the plant and is stored in the surrounding soil, sequestering the carbon in the ground. This carbon in the soil is known as soil organic carbon and it feeds microbes and fungi, which in turn provide nutrients for the plant. Soil organic carbon is the main component of soil organic matter, providing more structure to the soil and allowing it to store more water.
Carbon can remain stored in soils for thousands of years — or it can be quickly released back into the atmosphere through farm practices like plowing and tillage, where soil is prepared for planting by mechanical agitation methods such as digging, stirring, and overturning.
For farmers, regenerative agriculture is thus a win-win — it’s an approach that leads to better, more resilient crops grown using sustainable methods that at the same time fight a crisis that presents a threat to all agriculture.
And that’s why some of the biggest brands in the world are going all in.
General Mills, makers of some of your favorite cereals, granola bars, and other foods, is taking a multipronged approach to its support of regenerative agriculture. They’ve partnered with other organizations to develop resources and training to help farmers work toward the widespread adoption of soil health practices, including plans for “2 and 3-day soil health academies where famers will receive education from leading technical experts” and a verified regenerative sourcing program for some of its brands that will “allow consumers to easily identify food that has been sourced from farms verified to increase water, soil, and climate health.”
Learn More
In the end, Modern Farmer sums it up best: “This is how land should be taken care of and food should be grown – with benefits for the environment and the consumer.”
It’s just that simple.
Read more about the climate crisis’ effect on the health of our soil – and the future of our food – by downloading our free e-book, Right Under Your Feet: Soil Health and the Climate Crisis. In it, we get you the facts on:
- The impact of climate change on soil health.
- What’s at stake.
- What you can do to support a world where we can provide people with fresh, healthy food grown in a sustainable soil ecosystem.