
By Bob Henson
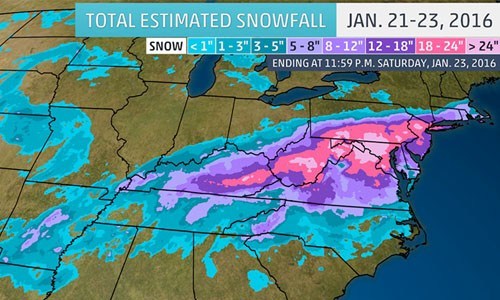
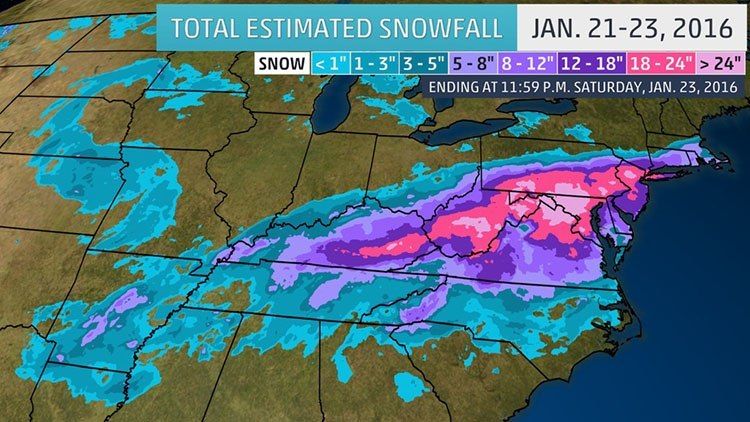
A ferocious, long-lasting winter storm took its parting swipes at the Eastern Seaboard on Saturday night, leaving in its wake a pile of snowbound cities and shattered records. Millions of people in the nation's most densely populated urban corridor saw snowfall amounts that matched or exceeded the largest amounts observed in more than a hundred years of recordkeeping. It's surprisingly difficult to measure snow in an accurate and consistent way, so you should keep a mental asterisk pinned to the statistics you'll be seeing. Nevertheless, there is no question that this nor'easter, dubbed Winter Storm Jonas by the Weather Channel, was one for the ages—among the most powerful and far-reaching in regional history.
A Sheaf of 24-Hour and Storm-Total Records
Even as the last flakes were flying on Saturday night, a number of sites with century-plus weather histories had already notched the most snowfall ever recorded for a single storm and/or the most ever measured in a 24-hour period. Here's a sample of preliminary data through Sunday morning. (Thanks to Alex Lamers, National Weather Service (NWS)/Tallahassee, for digging up some hard-to-find data on previous record storm totals in the New York City area). Note that the readings below generally pertain to snowfall measurements taken during the storm and added together, with a snow measuring board (snowboard) cleared off between each reading. The final snow depth or the amount you'd measure by sticking a ruler (or yardstick) in the snow at the end of the storm, would normally be a bit less than the amounts shown below, because of the more recent snow on top compressing the lower, earlier layers. Decades ago, snowboards were used less frequently or were cleared less often when used, which means that some past storms would yield higher snow totals if measured with today's standard techniques.
New York, New York (Central Park)
- Calendar-day total: 26.6" (old record 24.1" on Feb. 12, 2006)
- Storm total through Sunday a.m.: 26.8" (record 26.9" on Feb. 11-12, 2006)
New York, New York (LaGuardia)
- Calendar-day total: 27.9" (old record 23.3" on Feb. 12, 2006)
- Storm total through Sunday a.m.: 27.9" (old record 25.4" on Feb. 11-12, 2006)
New York, New York (Kennedy):
- Calendar-day total: 30.3" (old record 24.1" on Feb. 12, 2006)
- Storm total through Sunday a.m.: 30.5" (old record 26.8" on Feb. 16-18 2003)
Newark, New Jersey:
- Calendar-day total: 27.5" (old record 25.9" on Dec. 26, 1947)
- Storm total through Sunday a.m.: 27.9" (old record 27.8" on Jan. 7-8, 1996)
Allentown, Pennsylvania
- Calendar-day total: 30.2" (old record 24.0" on Feb. 11, 1983)
- Storm total through Sunday a.m.: 31.9" (old record 25.6" on Jan. 7-8, 1996)
Harrisburg, Pennsylvania
- Calendar-day total: 26.4" (old record 24.0" on Feb. 11, 1983)
- Storm total through Sunday a.m.: 30.2" (old record 25.0" on Feb. 12-13, 1983)
Philadelphia, Pennsylvania:
- Calendar-day total: 19.4" (record 27.6 on Jan. 7, 1996)
- Storm total through Sunday a.m.: 22.4" (record 31.0" on Jan. 6-8, 1996)
Baltimore, Maryland (Baltimore-Washington Airport and earlier sites):
- Calendar-day total: 25.5" (old record 23.3" on Jan. 28, 1922)
- Storm total through Sunday a.m.: 29.2" (old record 26.8" on Feb. 16-18, 2003)
Washington, DC (Dulles)
- Calendar-day total: 22.1" (record 22.5" on Feb. 11, 1983)
- Storm total through Sunday a.m.: 29.3" (record 32.4" on Feb. 5-6, 2010)
Washington, DC (National Airport and earlier sites):
- Calendar-day total: 11.3" (record 21.0" on Jan. 28, 1922)
- Storm total through Sunday a.m.: 17.8" (record 28.0" on Jan. 27-29, 1922)
How Widespread Was the Snow?
- This was the first storm on record to dump at least 24" of snow in both Baltimore and New York City, according to weather.com.
- At least one location in all 21 New Jersey counties received at least 12" of snow.
- Snowflakes fell as far south as the Florida Panhandle on Friday night and more than a foot of snow fell as far north as Massachusetts, giving this remarkable storm a north-to-south reach reminiscent of the even-more-sprawling Storm of the Century in March 1993.
Controversy in Washington, Snowfall-Style
As noted by Capital Weather Gang's Angela Fritz, the readings at Washington National through Saturday evening struck many as being oddly low compared to neighboring reports, especially toward the north and west. The NWS plans to review the DCA snow reports, which were gathered by contractors for the Federal Aviation Administration, a common practice at many airport locations. In a follow-up story on Sunday, Capital Weather Gang reported that the contractors at DCA had improvised and interpolated from snow-depth measurements after the on-site snowboard could not be found beneath the snow.
The Weather Underground almanac for Saturday at DCA shows that at 4:52 p.m. ET, Washington National reported 18" of snow on ground (rounded to the nearest inch), with 1" having fallen in the previous hour. Snow continued at DCA through midnight; however, the visibility jumped from just 1/16 mile at 4:52 p.m. to much higher values after that point (1/2 mile at 5:39 p.m. and 1.75 mile at 6:49 p.m.), which is consistent with snowfall becoming much lighter.
On Sunday morning, CoCoRaHS reports of snowfall on the ground were all 20" or greater in the District and the adjoining western and northern suburban counties of Fairfax County, Virginia and Montgomery County, Maryland. In the District itself, a snow depth of 22" was reported at the White House CoCoRaHS station, about 4 miles north of the airport and the closest station to DCA that filed a report on Sunday morning. Amounts were substantially lower just east and south of the District, in Prince George's County, Maryland and beyond, although very few of these were close to DCA. A snow-depth report of 16" came in from the vicinity of Fort Washington, about 8 miles south of DCA. To me, the CoCoRaHS data on snow depth imply that the DCA observations of total snowfall could be slightly on the low side but not too far out of line. It will be fascinating to see what the NWS concludes. Perhaps the bigger question is whether reports from DCA should be considered representative of the District, given that snowfalls are often significantly heavier as you go north and west.
Record Storm Tides Along the Southern New Jersey and Northern Delaware Coast
While most eyes were peeled on the big cities of the Northeast, coastal residents on either side of the Delaware Bay had to deal with major coastal flooding, especially during Saturday morning's high tide. Storm-related surges of 4 to 5 feet were common across northern Delaware and southern New Jersey. These are close to the highest values one would expect in any nor'easter. To make matters worse, the full moon added about a foot to the normal morning high tide. The resulting storm tide (the amount over the typical low tide or mean low low water, including both astronomical and storm-related effects) hit a record 9.27 feet at Lewes, Delaware, beating the 9.20 feet observed in the nor'easter of March 6, 1962. Cape May and Stone Harbor, New Jersey, both saw record storm tides that exceeded the values observed during Hurricane Sandy in 2012. Floodwaters poured into Stone Harbor in dramatic fashion on Saturday morning.
Radar loop of this historic blizzard from start to finish. Compiled by @BMcNoldy here: https://t.co/D5jaiGY8dD https://t.co/IMSi5iJGKT— Anthony Sagliani (@Anthony Sagliani)1453615697.0
North of Atlantic City, the storm surge fell far short of the values observed during Sandy. The circulation around Sandy (which made landfall near Atlantic City) drove far larger storm surges of 10 feet or more into the coasts and bays of northern New Jersey and New York, resulting in storm tides as high as 15 feet. Moreover, Sandy's huge waves—much bigger than those from Jonas—added greatly to the impact of the storm surge throughout the region. “Waves can contribute 50 percent or more to the coastal flooding along the open coastline and these are not included in storm tide measurements," Michael Lowry (The Weather Channel), said.
Widespread Power Outages
As of Saturday, more than 200,000 homes and businesses had lost power due to Jonas, although outages in the blizzard-socked areas were not nearly as widespread as had been feared. North Carolina was especially hard-hit by power losses due to a glaze of freezing rain that fell early in the storm, topped by a coating of snow.
Hats Off to the Computer Models and NWS Forecasts
One can't help but be impressed by the persistence and accuracy of the leading forecast models in predicting near-record snowfall amounts for days on end ahead of the arrival of Jonas. Early in the week, the GFS and ECMWF models correctly zeroed in on Maryland, including Washington, DC, as a focal point for heavy snow around Friday/Saturday. This gave local forecasters the confidence to issue a blizzard watch on Wednesday morning, two full days ahead of the storm's arrival. (The massive traffic tie-ups in the DC area on Wednesday evening were the result of a mere half-inch of snow from a separate storm that preceded Jonas, a vivid reminder that even minor-seeming winter weather events need to be taken seriously in urban areas.)
New York was a tougher forecast nut to crack. Models agreed that there would be a sharp cut-off to the northern edge of heavy snow, a feature common in nor'easters, but they disagreed on where that northern edge would fall. As early as Wednesday, the NAM model was projecting huge weekend snowfall amounts in the New York area, while the GFS and ECMWF models tended to hold the heavy snow just south of New York, projecting only a few inches at best for the Big Apple. Forecasters at the National Weather Service's local office in Upton, New York, wisely issued a prediction of 8-12" of snowfall and a blizzard watch on Thursday, just as blizzard warnings were being hoisted from Washington, DC to Philadelphia. In New York, this was the perfect situation for a watch, which is intended to alert the public that a particular outcome is possible but not guaranteed. As other models joined the NAM bandwagon on Friday, the blizzard watch for New York City was upgraded to a warning, which provided enough advance notice for city dwellers to stock up on provisions and city planners to prepare for the worst.
The storm ended up occluding in classic fashion, meaning that its main coastal surface low hung back while jet-stream energy carved out an occluded front extending northeastward just off the East Coast (see Figure 7). This evolution led to prime snowmaking conditions in a region of frontal formation aloft called a deformation zone that set up inland from the surface front, putting the heavy snow along and just northwest of the urban corridor. (Here's an NWS explanation of deformation zones.)
Weather Underground blogger Steve Gregory, like many others, saw the classic nature of this setup emerging in the NAM and GFS models on Friday, although even then he wasn't totally convinced. “Whenever a storm occludes out, it slows down and is pulled closer to the upper low (500 mb) and the storm track. Most importantly the deformation zone was then able to spiral further outward (northward) by 100-150 nautical miles, which brought very heavy snow bands into the New York City/Long Island/Cape Cod region," Steve told me in an email. “This should not have been a surprise to me."
The Outer Edge Strikes Again
Many New Yorkers remember the storm of late January 2015, when forecasters called for as much as 3 feet of snow in New York City, far more than actually fell there. Though that forecast might seem like a bust, the prediction of huge snows over much larger areas of eastern Long Island and southern New England actually proved correct. Again, the problem was a sharp cutoff to the heavy snow on the storm's outer edge, with models disagreeing on whether that edge would end up west or east of New York City. NWS forecasters went big, then held off on dialing back the forecasts until it was abundantly clear that New York City would escape the worst.
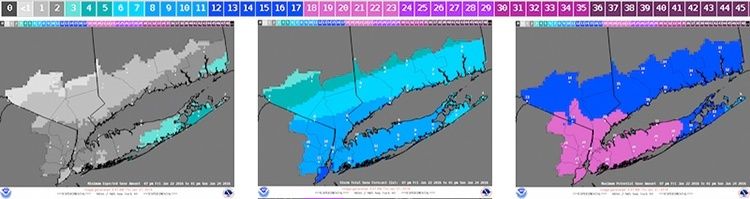
It's crucial that residents, businesses and local government understand that some storms have a wider range of uncertainty than others at a given location. The experimental probabilistic guidance for snowfall that was posted on the home page of the NWS/New York office (see Figure 6) helped provide that sense. On Friday, it showed a low-end outcome of just an inch, but a high-end outcome of around two feet. I look forward to seeing this valuable tool become operational across the nation as soon as possible.
YOU MIGHT ALSO LIKE
Armed Ships Embark on Secretive Plutonium Mission From Japan to the U.S.
Snow-Deprived Ski Industry Wants to Know What Ted Cruz Plans to Do About Climate Change
Why Are Flint Residents Being Forced to Pay for Their Toxic Water?
By Tara Lohan
A key part of the United States' clean energy transition has started to take shape, but you may need to squint to see it. About 2,000 wind turbines could be built far offshore, in federal waters off the Atlantic Coast, in the next 10 years. And more are expected.
Threats to Birds
<p>One of the gravest threats facing birds is climate change, according to Audubon, which found that rising temperatures threaten <a href="https://www.audubon.org/2019climateissue" target="_blank" rel="noopener noreferrer">nearly two-thirds of North America's bird species</a>. That's why the impending development of offshore wind is a good thing, says Shilo Felton, a field manager in the organization's Clean Energy Initiative, but it also comes with dangers to birds that need to be better studied and mitigated.</p><p>The most obvious risk comes from birds colliding with spinning turbine blades. But offshore wind developments can also displace birds from foraging or roost sites, as well as migratory pathways.</p><p>Along the Atlantic Coast four imperiled species are of top concern to conservationists: the endangered piping plover, red knot, roseate tern and black-capped petrel, which is being considered for listing under the Endangered Species Act.</p><p>"Those four species are of utmost importance to make sure that we understand the impacts," says Felton. "But beyond that there are many species that are protected under the Migratory Bird Treaty Act and the Fish and Wildlife Conservation Act that could potentially see more impacts from offshore wind."</p><p>Northern gannets, for example, are at risk not just for collision but <a href="https://www.researchgate.net/publication/308703197_Possible_impacts_of_offshore_wind_farms_on_seabirds_a_pilot_study_in_Northern_Gannets_in_the_southern_North_Sea" target="_blank">habitat displacement</a>.</p>A northern gannet flying along Cape May, N.J. Ann Marie Morrison / CC BY-NC-ND 2.0
<p>"There's <a href="https://www.sciencedirect.com/science/article/abs/pii/S0006320716303196" target="_blank">some evidence</a> that they just won't use areas where turbines are, but that also excludes them from key foraging areas," says Felton. Researchers are still studying what this may mean for the birds. But a <a href="https://www.sciencedirect.com/science/article/pii/S0141113620305304" target="_blank">study</a> published in December 2020 conducted at Bass Rock, Scotland — home to the world's largest northern gannet colony — found that wind developments could reduce their growth rate, though not enough to cause a population decline.</p><p>Other birds, such as great cormorants and European shags, are <a href="https://www.sciencedirect.com/science/article/abs/pii/S0006320716303196" target="_blank">attracted to wind developments</a> and use the infrastructure to rest while opening up new foraging areas farther from shore.</p><p>"There's plenty of potential for a bird to use a wind farm and still to avoid the turbines themselves," says Felton.</p><p>Birds like pelicans, however, are less versatile in their movements and are at particular risk of collision because of their flight pattern, she says.</p><p>But how disruptive or dangerous offshore turbines will be along the East Coast isn't yet known.</p><p>Federal and state agencies, along with nongovernmental organizations, says Felton, have done good research to try to better understand those potential impacts. "But these are all theoretical, because we don't have a lot of offshore wind yet in the United States."</p>Threats to Ocean Life
<p>Birds aren't the only wildlife of concern. More development in ocean waters could affect a litany of marine species, some of which are already facing other pressures from overfishing, pollution, habitat destruction and climate change.</p><p>Scientists have found that marine mammals like whales and dolphins could be disturbed by the jarring sounds of construction, especially if pile driving is used to hammer the steel turbine platform into the seafloor.</p><p>The noises, though short-lived, could impede communication between animals, divert them from migration routes or cause them to seek less suitable areas for feeding or breeding. Research from Europe found that harbor porpoises, seals and dolphins may avoid development areas during construction. In most, but <a href="https://iopscience.iop.org/article/10.1088/1748-9326/7/4/045101" target="_blank">not all cases</a>, the animals were believed to have returned to the area following construction.</p><p>The biggest concern for conservation groups in the United States is the critically endangered North American right whale. There are fewer than 400 remaining, and the species' habitat overlaps with a number of planned wind development areas along the East Coast.</p><p>"Offshore wind is in no way the cause of the challenges the whales face, but it's going to be another pressure point," says John Rogers, senior energy analyst for the Union of Concerned Scientists.</p><p>Researchers aren't sure how right whales will respond to the noise from pile driving.</p><p>"But we are concerned, based on what we know about how whales react to other noise sources, that they may avoid [wind development] areas," says Kershaw.</p><p>And if that displacement causes them to miss out on important food resources, it could be dangerous for a species already on the brink.</p><p>There are a few other potential threats, too.</p><p>Ships associated with the development — more plentiful during construction — also pose a danger. In the past few years cargo ships, fishing boats and other vessels have caused half of all deaths of North Atlantic right whales.</p>A juvenile right whale breaches against the backdrop of a ship near the St. Johns River entrance. Florida Fish and Wildlife Conservation Commission / NOAA Research Permit #775-1600-10
<p>And after construction, the noise from the spinning turbines will be present in the water at low decibels. "We don't quite know how the great whales will react to those sounds," says Jeremy Firestone, the director of the Center for Research in Wind at the University of Delaware.</p><p>Other marine mammals may also perceive the noise, but at low decibels it's unlikely to be an impediment, <a href="http://www.int-res.com/abstracts/meps/v309/p279-295/" target="_blank">research has found</a>.</p><p>And it's possible that wind development could help some ocean life. Turbine foundations can attract fish and invertebrates for whom hard substrates create habitat complexity — known as the "reef effect," according to researchers from the University of Rhode Island's <a href="https://dosits.org/animals/effects-of-sound/anthropogenic-sources/wind-turbine/" target="_blank" rel="noopener noreferrer">Discovery of Sound in the Sea</a> program. Exclusion of commercial fishing nearby may also help shelter fish and protect marine mammals from entanglements in fishing gear.</p>Ensuring Safe Development
<p>Despite the potential dangers, researchers have gathered a few best practices to help diminish and possibly eliminate some risks.</p><p>When it comes to ship strikes, the easiest thing is to slow boats down, mandating a speed of <a href="https://biologicaldiversity.org/w/news/press-releases/vessel-speed-limits-sought-protect-endangered-north-atlantic-right-whales-2020-08-06/" target="_blank">10 knots</a> in wind development areas, and using visual and acoustic monitoring for whales.</p><p>Adjusting operations to reduce boat trips between the shore and the wind development will also help. A new series of service operating vessels can allow maintenance staff to spent multiple days onsite, says Kershaw, cutting down on boat traffic.</p><p>For construction noise concerns, developers can avoid pile driving during times of the year when whales are present. And, depending on the marine environment, developers could use "quiet foundations" that don't require pile driving. These include gravity-based or suction caisson platforms.</p><p>Floating turbines are also used in deep water, where they're effectively anchored in place — although that poses its own potential danger. "We have concerns that marine debris could potentially become entangled around the mooring cables of the floating arrays and pose a secondarily entanglement risk to some species," says Felton, who thinks more research should be conducted before those become operational in U.S. waters — a process that's already underway in Maine, where a <a href="https://composites.umaine.edu/2020/08/05/diamond-offshore-wind-rwe-renewables-join-the-university-of-maine-to-lead-development-of-maine-floating-offshore-wind-demonstration-project/" target="_blank" rel="noopener noreferrer">demonstration project is being built</a>.</p><p>If loud noises are unavoidable during construction, noise-reducing technologies such as bubble curtains can help dampen the sound. And scheduling adjacent projects to conduct similar work at the same time could limit the duration of disturbances.</p>The foundation installation of the off shore wind farm Sandbank using a bubble curtain. Vattenfall / Ulrich Wirrwa / CC BY-NC-ND 2.0
<p>Once turbines become operational, reducing the amount of light on wind platforms or using flashing lights could help deter some seabirds, NRDC <a href="https://www.nrdc.org/sites/default/files/harnessing-wind-advance-wind-power-offshore-ib.pdf" target="_blank" rel="noopener noreferrer">researchers reported</a>. And scientists are exploring using ultrasonic noises and ultraviolet lighting to keep bats away. "Feathering," or shutting down the turbine blades during key migration times, could also help prevent fatalities.</p><p>"We need to make sure that offshore wind is the best steward it can be of the marine ecosystem, because we want and expect it to be a significant part of the clean energy picture in some parts of the country," says Rogers. "We also have to recognize that we're going to learn by doing, and that some of these things we're going to figure out best once we have more turbines in the water."</p><p>That's why environmental groups say it's important to establish baseline information on species before projects begin, and then require developers to conduct monitoring during construction and for years after projects are operational.</p><p>Employing an "adaptive management framework" will ensure that developers can adjust their management practices as they go when new information becomes available, and that those best practices are incorporated into the requirements for future projects.</p>Putting Research Into Action
<p>Advancing these conversations at the federal level during the Trump administration, though, has been slow going.</p><p>"We didn't really have any productive discussions with the administration in the last four years," says Kershaw.</p><p>And when it comes to birds, Felton says the Bureau of Ocean Energy Management's recently completed "draft cumulative environmental impact statement" covering offshore wind developments had a lot of good environmental research, but little focus on birds.</p><p>"Part of that comes from the current administration's interpretation of the Migratory Bird Treaty Act," she says.</p><p>President Trump has been hostile to both wind energy <em>and</em> birds, <a href="https://www.nytimes.com/2021/01/05/climate/trump-migratory-bird-protections.html" target="_blank">and finished gutting the Migratory Bird Treaty Act</a> in his administration's the final days, removing penalties for companies whose operations kill migratory birds.</p><p>There's hope that the Biden administration will take a different approach. But where the federal government has been lacking lately, Kershaw says, they've seen states step up.</p><p>New York, for example, has established an <a href="https://www.nyetwg.com/" target="_blank" rel="noopener noreferrer">Environmental Technical Working Group</a> composed of stakeholders to advise on environmentally responsible development of offshore wind.</p><p>The group is led by the New York State Energy Research and Development Authority, but it isn't limited to the Empire State. It's regional in focus and includes representatives from wind developers with leases between Massachusetts and North Carolina; state agencies from Massachusetts to Virginia; federal agencies; and science-based environmental NGOs.</p><p>New York's latest solicitation for clean energy projects includes up to 2,500 megawatts of offshore wind and <a href="https://www.nyetwg.com/announcements" target="_blank" rel="noopener noreferrer">requires developers</a> to contribute at least $10,000 per megawatt for regional monitoring of fisheries and other wildlife.</p><p>Environmental groups have also worked directly with developers, including an agreement with Vineyard Wind — an 800-megawatt project off the Massachusetts coast that could be the first utility-scale wind development in federal waters — to help protect North Atlantic right whales.</p><p>The agreement includes no pile driving from Jan. 1 to April 30, ceasing activities at other times when whales are visually or acoustically identified in the area, speed restrictions on vessels, and the use of noise reduction technology, such as a bubble curtain during pile driving.</p><p>"The developers signed the agreement with us, and then they incorporated, most, if not all of those measures into the federal permitting documents," says Kershaw. "The developers really did a lot of bottom up work to make sure that they were being very protective of right whales."</p><p>Environmental groups are in talks with other developers on agreements too, but Felton wants to see best practices being mandated at the federal level.</p><p>"It's the sort of a role that should be being played by the federal government, and without that it makes the permitting and regulation process less stable and less transparent," she says." And that in turn slows down the build out of projects, which is also bad for birds because it doesn't help us address and mitigate for climate change."</p><p>Kershaw agrees there's a lot more work to be done, especially at the federal level, but thinks we're moving in the right direction.</p><p>"I think the work that's been done so far in the United States has really laid the groundwork for advancing this in the right way and in a way that's protective of species and the environment," she says. "At the same time, it's important that offshore wind does advance quickly. We really need it to help us combat the worst effects of climate change."</p><p><em><a href="https://therevelator.org/author/taralohan/" target="_blank" rel="noopener noreferrer">Tara Lohan</a> is deputy editor of The Revelator and has worked for more than a decade as a digital editor and environmental journalist focused on the intersections of energy, water and climate. Her work has been published by The Nation, American Prospect, High Country News, Grist, Pacific Standard and others. She is the editor of two books on the global water crisis.</em></p><p><em style="">Reposted with permission from <a href="https://therevelator.org/offshore-wind-wildlife" target="_blank" style="">The Revelator</a>. </em></p>- U.S. Offshore Wind Power Blown on Course - EcoWatch ›
- How Renewable Energy Could Power Your State - EcoWatch ›
EcoWatch Daily Newsletter
Cities Can Help Migrating Birds on Their Way By Planting More Trees and Turning Lights Off at Night
By Frank La Sorte and Kyle Horton
Millions of birds travel between their breeding and wintering grounds during spring and autumn migration, creating one of the greatest spectacles of the natural world. These journeys often span incredible distances. For example, the Blackpoll warbler, which weighs less than half an ounce, may travel up to 1,500 miles between its nesting grounds in Canada and its wintering grounds in the Caribbean and South America.
Blackpoll warbler abundance in breeding, non-breeding and migration seasons. Cornell Lab of Ornithology / CC BY-ND
<p>For many species, these journeys take place at night, when skies typically are calmer and predators are less active. Scientists do not have a good understanding yet of how birds navigate effectively at night over long distances.</p><p><span></span>We study bird migration and how it is being affected by factors ranging from <a href="https://scholar.google.com/citations?user=S04C3UMAAAAJ&hl=en" target="_blank">climate change</a> to <a href="https://scholar.google.com/citations?user=pPk38-8AAAAJ&hl=en" target="_blank">artificial light at night</a>. In a recent study, we used millions of bird observations by citizen scientists to document the <a href="https://doi.org/10.1016/j.envpol.2020.116085" target="_blank">occurrence of migratory bird species in 333 U.S. cities</a> during the winter, spring, summer and autumn.</p>Blackpoll warbler. PJTurgeon / Wikipedia
<p>We used this information to determine how the number of migratory bird species varies based on each city's level of <a href="https://www.britannica.com/science/light-pollution" target="_blank" rel="noopener noreferrer">light pollution</a> – brightening of the night sky caused by artificial light sources, such as buildings and streetlights. We also explored how species numbers vary based on the quantity of tree canopy cover and impervious surface, such as concrete and asphalt, within each city. Our findings show that cities can help migrating birds by planting more trees and reducing light pollution, especially during spring and autumn migration.</p>Declining Bird Populations
<p>Urban areas contain numerous dangers for migratory birds. The biggest threat is the risk of <a href="https://doi.org/10.1650/CONDOR-13-090.1" target="_blank">colliding with buildings or communication towers</a>. Many migratory bird populations have <a href="http://dx.doi.org/10.1126/science.aaw1313" target="_blank">declined over the past 50 years</a>, and it is possible that light pollution from cities is contributing to these losses.</p><p>Scientists widely agree that light pollution can <a href="https://doi.org/10.1073/pnas.1708574114" target="_blank">severely disorient migratory birds</a> and make it hard for them to navigate. Studies have shown that birds will cluster around brightly lit structures, much like insects flying around a porch light at night. Cities are the <a href="https://doi.org/10.1002/fee.2029" target="_blank" rel="noopener noreferrer">primary source of light pollution for migratory birds</a>, and these species tend to be more abundant within cities <a href="https://onlinelibrary.wiley.com/doi/abs/10.1111/gcb.13792" target="_blank" rel="noopener noreferrer">during migration</a>, especially in <a href="https://doi.org/10.1016/j.landurbplan.2020.103892" target="_blank" rel="noopener noreferrer">city parks</a>.</p>Composite image of the continental U.S. at night from satellite photos. NASA Earth Observatory images by Joshua Stevens, using Suomi NPP VIIRS data from Miguel Román, NASA's Goddard Space Flight Center
The Power of Citizen Science
<p>It's not easy to observe and document bird migration, especially for species that migrate at night. The main challenge is that many of these species are very small, which limits scientists' ability to use electronic tracking devices.</p><p>With the growth of the internet and other information technologies, new data resources are becoming available that are making it possible to overcome some of these challenges. <a href="https://doi.org/10.1038/d41586-018-07106-5" target="_blank">Citizen science initiatives</a> in which volunteers use online portals to enter their observations of the natural world have become an important resource for researchers.</p><p>One such initiative, <a href="https://ebird.org/home" target="_blank" rel="noopener noreferrer">eBird</a>, allows bird-watchers around the globe to share their observations from any location and time. This has produced one of the <a href="https://doi.org/10.1111/ecog.04632" target="_blank" rel="noopener noreferrer">largest ecological citizen-science databases in the world</a>. To date, eBird contains over 922 million bird observations compiled by over 617,000 participants.</p>Light Pollution Both Attracts and Repels Migratory Birds
<p>Migratory bird species have evolved to use certain migration routes and types of habitat, such as forests, grasslands or marshes. While humans may enjoy seeing migratory birds appear in urban areas, it's generally not good for bird populations. In addition to the many hazards that exist in urban areas, cities typically lack the food resources and cover that birds need during migration or when raising their young. As scientists, we're concerned when we see evidence that migratory birds are being drawn away from their traditional migration routes and natural habitats.</p><p>Through our analysis of eBird data, we found that cities contained the greatest numbers of migratory bird species during spring and autumn migration. Higher levels of light pollution were associated with more species during migration – evidence that light pollution attracts migratory birds to cities across the U.S. This is cause for concern, as it shows that the influence of light pollution on migratory behavior is strong enough to increase the number of species that would normally be found in urban areas.</p><p>In contrast, we found that higher levels of light pollution were associated with fewer migratory bird species during the summer and winter. This is likely due to the scarcity of suitable habitat in cities, such as large forest patches, in combination with the adverse affects of light pollution on bird behavior and health. In addition, during these seasons, migratory birds are active only during the day and their populations are largely stationary, creating few opportunities for light pollution to attract them to urban areas.</p>Trees and Pavement
<p>We found that tree canopy cover was associated with more migratory bird species during spring migration and the summer. Trees provide important habitat for migratory birds during migration and the breeding season, so the presence of trees can have a strong effect on the number of migratory bird species that occur in cities.</p><p>Finally, we found that higher levels of impervious surface were associated with more migratory bird species during the winter. This result is somewhat surprising. It could be a product of the <a href="https://www.epa.gov/heatislands" target="_blank">urban heat island effect</a> – the fact that structures and paved surfaces in cities absorb and reemit more of the sun's heat than natural surfaces. Replacing vegetation with buildings, roads and parking lots can therefore make cities significantly warmer than surrounding lands. This effect could reduce cold stress on birds and increase food resources, such as insect populations, during the winter.</p><p>Our research adds to our understanding of how conditions in cities can both help and hurt migratory bird populations. We hope that our findings will inform urban planning initiatives and strategies to reduce the harmful effects of cities on migratory birds through such measures as <a href="https://www.arborday.org/programs/treecityusa/index.cfm" target="_blank" rel="noopener noreferrer">planting more trees</a> and initiating <a href="https://aeroecolab.com/uslights" target="_blank" rel="noopener noreferrer">lights-out programs</a>. Efforts to make it easier for migratory birds to complete their incredible journeys will help maintain their populations into the future.</p><p><em><span style="background-color: initial;"><a href="https://theconversation.com/profiles/frank-la-sorte-1191494" target="_blank">Frank La Sorte</a> is a r</span>esearch associate at the </em><em>Cornell Lab of Ornithology, Cornell University. <a href="https://theconversation.com/profiles/kyle-horton-1191498" target="_blank">Kyle Horton</a> is an assistant professor of Fish, Wildlife, and Conservation Biology at the Colorado State University.</em></p><p><em></em><em>Disclosure statement: Frank La Sorte receives funding from The Wolf Creek Charitable Foundation and the National Science Foundation (DBI-1939187). K</em><em>yle Horton does not work for, consult, own shares in or receive funding from any company or organization that would benefit from this article, and has disclosed no relevant affiliations beyond their academic appointment.</em></p><p><em>Reposted with permission from <a href="https://theconversation.com/cities-can-help-migrating-birds-on-their-way-by-planting-more-trees-and-turning-lights-off-at-night-152573" target="_blank">The Conversation</a>. </em></p>Trending
By Lynne Peeples
Editor's note: This story is part of a nine-month investigation of drinking water contamination across the U.S. The series is supported by funding from the Park Foundation and Water Foundation. Read the launch story, "Thirsting for Solutions," here.
In late September 2020, officials in Wrangell, Alaska, warned residents who were elderly, pregnant or had health problems to avoid drinking the city's tap water — unless they could filter it on their own.
Unintended Consequences
<p>Chemists first discovered disinfection by-products in treated drinking water in the 1970s. The trihalomethanes they found, they determined, had resulted from the reaction of chlorine with natural organic matter. Since then, scientists have identified more than 700 additional disinfection by-products. "And those only represent a portion. We still don't know half of them," says Richardson, whose lab has identified hundreds of disinfection by-products. </p>What’s Regulated and What’s Not?
<p>The U.S. Environmental Protection Agency (EPA) currently regulates 11 disinfection by-products — including a handful of trihalomethanes (THM) and haloacetic acids (HAA). While these represent only a small fraction of all disinfection by-products, EPA aims to use their presence to indicate the presence of other disinfection by-products. "The general idea is if you control THMs and HAAs, you implicitly or by default control everything else as well," says Korshin.</p><p>EPA also requires drinking water facilities to use techniques to reduce the concentration of organic materials before applying disinfectants, and regulates the quantity of disinfectants that systems use. These rules ultimately can help control levels of disinfection by-products in drinking water.</p>Click the image for an interactive version of this chart on the Environmental Working Group website.
<p>Still, some scientists and advocates argue that current regulations do not go far enough to protect the public. Many question whether the government is regulating the right disinfection by-products, and if water systems are doing enough to reduce disinfection by-products. EPA is now seeking public input as it considers potential revisions to regulations, including the possibility of regulating additional by-products. The agency held a <a href="https://www.epa.gov/dwsixyearreview/potential-revisions-microbial-and-disinfection-byproducts-rules" target="_blank">two-day public meeting</a> in October 2020 and plans to hold additional public meetings throughout 2021.</p><p>When EPA set regulations on disinfection by-products between the 1970s and early 2000s, the agency, as well as the scientific community, was primarily focused on by-products of reactions between organics and chlorine — historically the most common drinking water disinfectant. But the science has become increasingly clear that these chlorinated chemicals represent a fraction of the by-product problem.</p><p>For example, bromide or iodide can get caught up in the reaction, too. This is common where seawater penetrates a drinking water source. By itself, bromide is innocuous, says Korshin. "But it is extremely [reactive] with organics," he says. "As bromide levels increase with normal treatment, then concentrations of brominated disinfection by-products will increase quite rapidly."</p><p><a href="https://pubmed.ncbi.nlm.nih.gov/15487777/" target="_blank">Emerging</a> <a href="https://pubs.acs.org/doi/10.1021/acs.est.7b05440" target="_blank" rel="noopener noreferrer">data</a> indicate that brominated and iodinated by-products are potentially more harmful than the regulated by-products.</p><p>Almost half of the U.S. population lives within 50 miles of either the Atlantic or Pacific coasts, where saltwater intrusion can be a problem for drinking water supplies. "In the U.S., the rule of thumb is the closer to the sea, the more bromide you have," says Korshin, noting there are also places where bromide naturally leaches out from the soil. Still, some coastal areas tend to be spared. For example, the city of Seattle's water comes from the mountains, never making contact with seawater and tending to pick up minimal organic matter.</p><p>Hazardous disinfection by-products can also be an issue with desalination for drinking water. "As <a href="https://ensia.com/features/can-saltwater-quench-our-growing-thirst/" target="_blank" rel="noopener noreferrer">desalination</a> practices become more economical, then the issue of controlling bromide becomes quite important," adds Korshin.</p>Other Hot Spots
<p>Coastal areas represent just one type of hot spot for disinfection by-products. Agricultural regions tend to send organic matter — such as fertilizer and animal waste — into waterways. Areas with warmer climates generally have higher levels of natural organic matter. And nearly any urban area can be prone to stormwater runoff or combined sewer overflows, which can contain rainwater as well as untreated human waste, industrial wastewater, hazardous materials and organic debris. These events are especially common along the East Coast, notes Sydney Evans, a science analyst with the nonprofit Environmental Working Group (EWG, a collaborator on <a href="https://ensia.com/ensia-collections/troubled-waters/" target="_blank">this reporting project</a>).</p><p>The only drinking water sources that might be altogether free of disinfection by-products, suggests Richardson, are private wells that are not treated with disinfectants. She used to drink water from her own well. "It was always cold, coming from great depth through clay and granite," she says. "It was fabulous."</p><p>Today, Richardson gets her water from a city system that uses chloramine.</p>Toxic Treadmill
<p>Most community water systems in the U.S. use chlorine for disinfection in their treatment plant. Because disinfectants are needed to prevent bacteria growth as the water travels to the homes at the ends of the distribution lines, sometimes a second round of disinfection is also added in the pipes.</p><p>Here, systems usually opt for either chlorine or chloramine. "Chloramination is more long-lasting and does not form as many disinfection by-products through the system," says Steve Via, director of federal relations at the American Water Works Association. "Some studies show that chloramination may be more protective against organisms that inhabit biofilms such as Legionella."</p>Alternative Approaches
<p>When he moved to the U.S. from Germany, Prasse says he immediately noticed the bad taste of the water. "You can taste the chlorine here. That's not the case in Germany," he says.</p><p>In his home country, water systems use chlorine — if at all — at lower concentrations and at the very end of treatment. In the Netherlands, <a href="https://dwes.copernicus.org/articles/2/1/2009/dwes-2-1-2009.pdf" target="_blank">chlorine isn't used at all</a> as the risks are considered to outweigh the benefits, says Prasse. He notes the challenge in making a convincing connection between exposure to low concentrations of disinfection by-products and health effects, such as cancer, that can occur decades later. In contrast, exposure to a pathogen can make someone sick very quickly.</p><p>But many countries in Europe have not waited for proof and have taken a precautionary approach to reduce potential risk. The emphasis there is on alternative approaches for primary disinfection such as ozone or <a href="https://www.pbs.org/wgbh/nova/article/eco-friendly-way-disinfect-water-using-light/" target="_blank" rel="noopener noreferrer">ultraviolet light</a>. Reverse osmosis is among the "high-end" options, used to remove organic and inorganics from the water. While expensive, says Prasse, the method of forcing water through a semipermeable membrane is growing in popularity for systems that want to reuse wastewater for drinking water purposes.</p><p>Remucal notes that some treatment technologies may be good at removing a particular type of contaminant while being ineffective at removing another. "We need to think about the whole soup when we think about treatment," she says. What's more, Remucal explains, the mixture of contaminants may impact the body differently than any one chemical on its own. </p><p>Richardson's preferred treatment method is filtering the water with granulated activated carbon, followed by a low dose of chlorine.</p><p>Granulated activated carbon is essentially the same stuff that's in a household filter. (EWG recommends that consumers use a <a href="https://www.ewg.org/tapwater/reviewed-disinfection-byproducts.php#:~:text=EWG%20recommends%20using%20a%20home,as%20trihalomethanes%20and%20haloacetic%20acids." target="_blank" rel="noopener noreferrer">countertop carbon filter</a> to reduce levels of disinfection by-products.) While such a filter "would remove disinfection by-products after they're formed, in the plant they remove precursors before they form by-products," explains Richardson. She coauthored a <a href="https://pubs.acs.org/doi/10.1021/acs.est.9b00023" target="_blank" rel="noopener noreferrer">2019 paper</a> that concluded the treatment method is effective in reducing a wide range of regulated and unregulated disinfection by-products.</p><br>Greater Cincinnati Water Works installed a granulated activated carbon system in 1992, and is still one of relatively few full-scale plants that uses the technology. Courtesy of Greater Cincinnati Water Works.
<p>Despite the technology and its benefits being known for decades, relatively few full-scale plants use granulated active carbon. They often cite its high cost, Richardson says. "They say that, but the city of Cincinnati [Ohio] has not gone bankrupt using it," she says. "So, I'm not buying that argument anymore."</p><p>Greater Cincinnati Water Works installed a granulated activated carbon system in 1992. On a video call in December, Jeff Swertfeger, the superintendent of Greater Cincinnati Water Works, poured grains of what looks like black sand out of a glass tube and into his hand. It was actually crushed coal that has been baked in a furnace. Under a microscope, each grain looks like a sponge, said Swertfeger. When water passes over the carbon grains, he explained, open tunnels and pores provide extensive surface area to absorb contaminants.</p><p>While the granulated activated carbon initially was installed to address chemical spills and other industrial contamination concerns in the Ohio River, Cincinnati's main drinking water source, Swertfeger notes that the substance has turned out to "remove a lot of other stuff, too," including <a href="https://ensia.com/features/drinking-water-contamination-pfas-health/" target="_blank" rel="noopener noreferrer">PFAS</a> and disinfection by-product precursors.</p><p>"We use about one-third the amount of chlorine as we did before. It smells and tastes a lot better," he says. "The use of granulated activated carbon has resulted in lower disinfection by-products across the board."</p><p>Richardson is optimistic about being able to reduce risks from disinfection by-products in the future. "If we're smart, we can still kill those pathogens and lower our chemical disinfection by-product exposure at the same time," she says.</p><p><em>Reposted with permission from </em><em><a href="https://ensia.com/features/drinking-water-disinfection-byproducts-pathogens/" target="_blank">Ensia</a>. </em><a href="https://www.ecowatch.com/r/entryeditor/2649953730#/" target="_self"></a></p>At a time of impending global food scarcity, cell-based meats and seafood have been heralded as the future of food.
- Most Meat Will Be Plant-Based or Lab-Grown in 20 Years, Analysts ... ›
- Lab-Grown Meat Debate Overlooks Cows' Range of Use Worldwide ... ›
- Will Plant-Based Meat Become the New Fast Food? - EcoWatch ›
One city in New Zealand knows what its priorities are.
Dunedin, the second largest city on New Zealand's South Island, has closed a popular road to protect a mother sea lion and her pup, The Guardian reported.