
By Andrew Smith
Climate change is harming many special places and iconic species around our planet, from Glacier National Park's disappearing glaciers to California redwoods scorched by wildfires. But for the animal I study, the American pika (Ochotona princeps), there's actually some good news: It's not as threatened by climate change as many studies have warned.
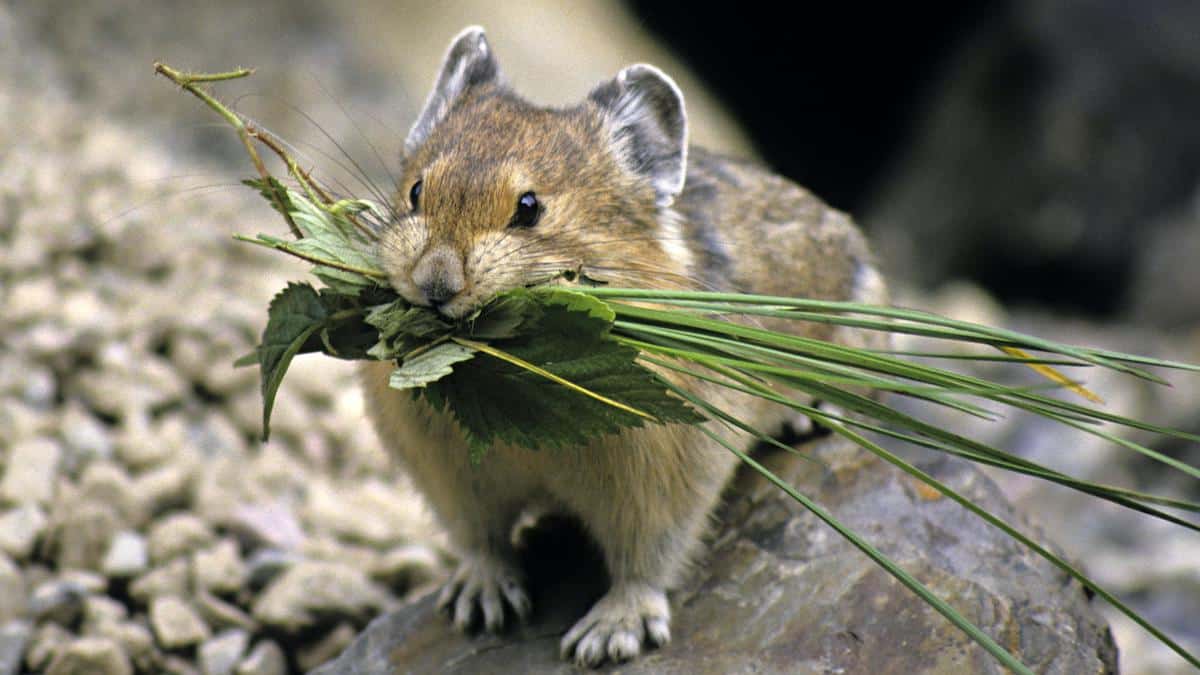
I have studied pikas, small cousins of rabbits, for over 50 years and never tire of watching them. These tailless, egg-shaped balls of fluff live primarily in cool mountainous environments in piles of broken rock, called talus.
During summer, observers can see pikas industriously gathering caches of grass and leaves into haypiles that will serve as their food supply through the winter. Their light brown coats blend well with their surroundings, so they are easiest to spot when they perch on prominent rocks and call to alert other pikas of their presence.
When fellow hikers see me observing pikas in California's Sierra Nevada, they often tell me they have read that these animals are going extinct. I have collected a stack of press releases that say exactly that. But based on my recent research and a comprehensive review of over 100 peer-reviewed studies, I believe that this interpretation is misleading.
Constrained by Climate
As I showed in my early research, pikas' biology suggests that they are likely to be affected by a warming climate. Most important, their normal body temperature is high, and this puts them at risk of overheating when active in warm environments. When temperatures are warm, pikas retreat into the much cooler depths of their talus habitat.
Temperature also plays a role in pikas' ability to move from place to place. Warm weather inhibits their movements, while cooler temperatures allow them to more freely colonize new habitats.
A little ancient history is instructive here. Pikas originally came to North America from Asia and spread across the continent some five million years ago, during colder times. Their remains have been found in caves in the Appalachian Mountains and in the Mojave Desert – sites where pikas no longer live.
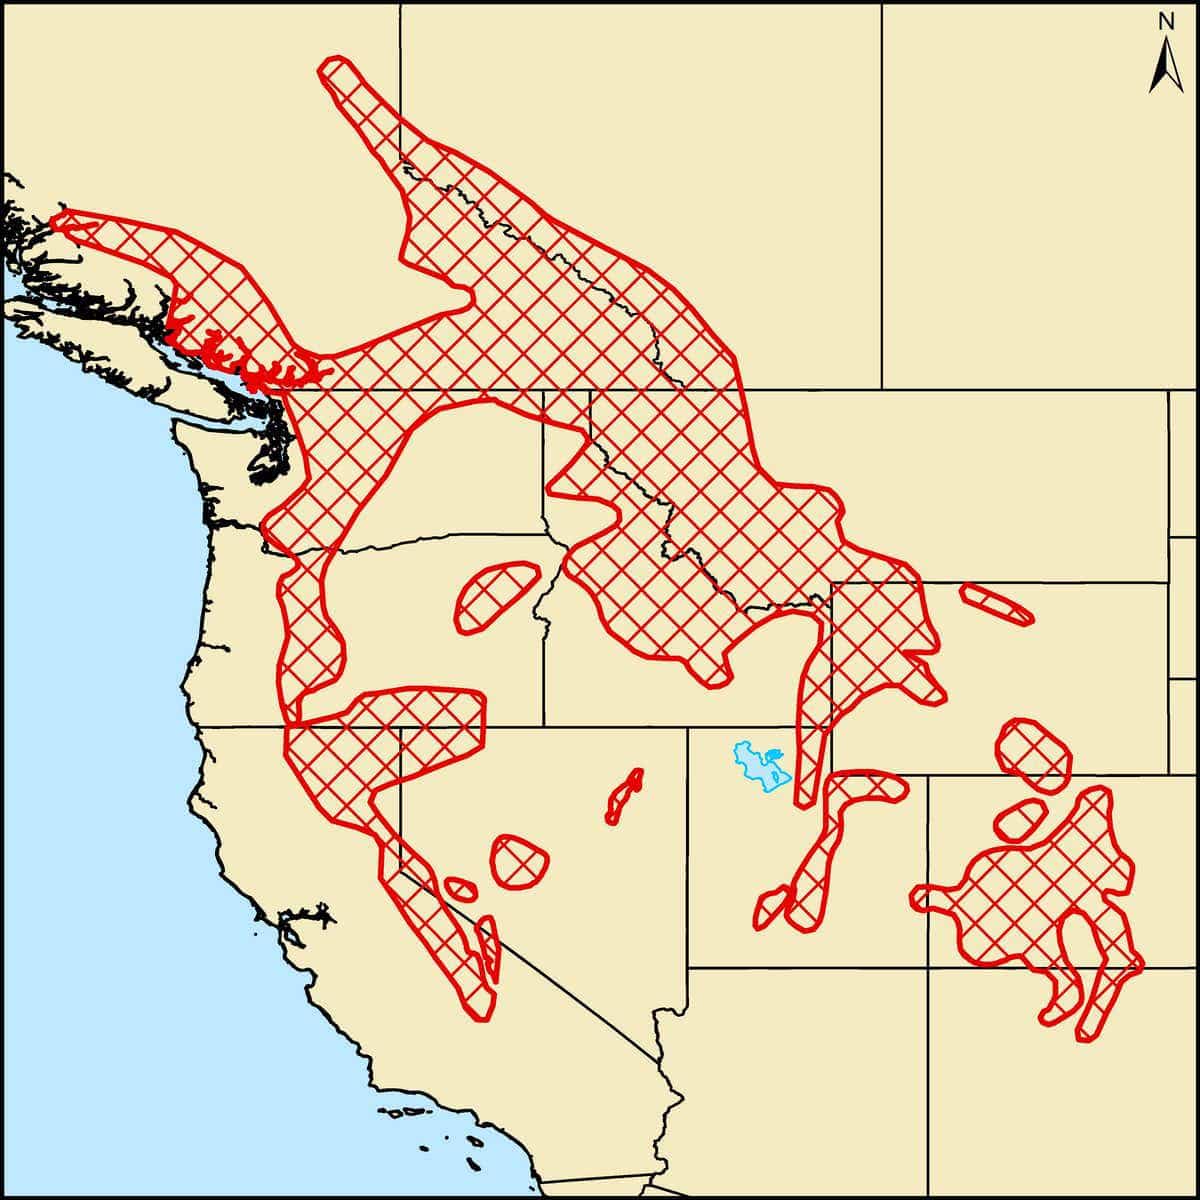
American pikas live mainly in alpine and subalpine mountain areas extending south from central British Columbia and Alberta into the Rocky Mountains of New Mexico and the Sierra Nevada of California. Andrew Smith, CC BY-ND
As the world's climate warmed, pika populations retreated to the high mountains of the western U.S. and Canada. Today they occupy most of the available talus habitat in these areas – evidence that challenges the pikas-on-the-brink narrative.
For example, in recent surveys, pikas were found at 98% of 109 suitable sites in Colorado, and at 98% of 329 sites in the central Sierra Nevada. One study of historic pika sites across California's Lassen, Yosemite, Kings Canyon and Sequoia National Parks found no evidence that pikas were moving to new sites or higher altitudes due to climate change.
Pikas in Warm Environments
In contrast, most sites where researchers believe that pikas have disappeared are small, isolated and often compromised by human activities, such as grazing by livestock. These sites generally are lower and warmer than sites in pikas' core range.
Many of these areas are in the Great Basin – a large desert region spanning most of Nevada and parts of Utah, Idaho, Wyoming, Oregon and California. A series of studies on a small number of marginal Great Basin sites formerly occupied by pikas has disproportionately contributed to the narrative that pikas are likely to become endangered.
To investigate the big picture across this region, I worked with state and federal officials on a 2017 study that identified 3,250 site records of pika habitat. Pikas were present at 2,378 sites, not found at 89 sites where they had been seen as recently as 2005, and absent from 774 sites that contained only old signs of pika occupancy.
The extirpated and old sites had the same temperature and precipitation ranges as sites where pikas still were present. This suggests that non-climatic factors may have caused pikas' disappearance from the vacant sites.
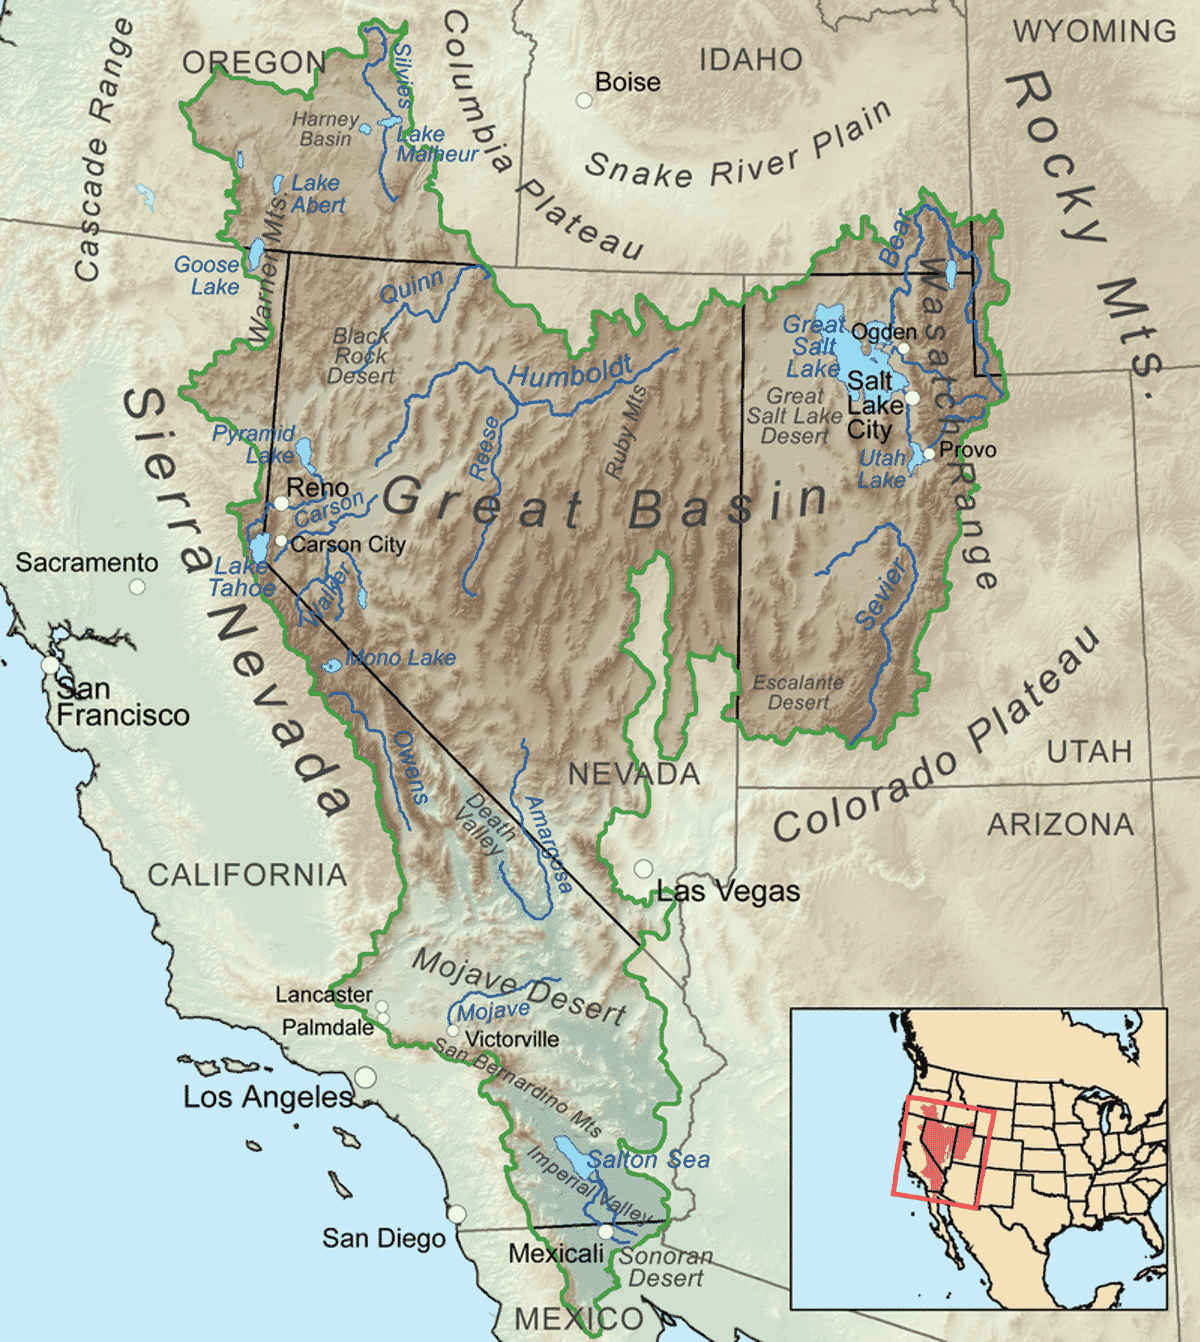
Pikas have disappeared from some parts of the Great Basin, but climate change may not have been the cause. Kmusser / Wikipedia, CC BY-S
Pikas are still present in other remarkably hot places, such as the ghost town of Bodie, California, the nearby Mono Craters and Idaho's Craters of the Moon National Monument. At these sites, pikas retreat into the cool nooks of their talus habitat during the warmest part of the day and often forage at night.
In my research, I also found that pikas were much less active and uttered far fewer calls at these low-altitude sites compared with high-elevation pika populations. At low-elevation sites, pikas consumed a diverse diet of Great Basin plants, such as big sagebrush and bitterbrush, that was markedly different from the plants they ate at high-elevation sites. Some even failed to construct their characteristic large haypiles.
Another atypical pika population lives near sea level in Oregon's Columbia River Gorge. Here, too, they have adapted well to a very different habitat, surviving year-round on a diet that consists mainly of moss. They defend the smallest territories of any pika, and when it gets hot, they simply move off the talus and hang out in the shade of the nearby forest.
A Future for Pikas
Based on my review of dozens of studies, pika populations appear to be secure in their core range – the mountains of western North America that have large and fairly well-connected talus habitat. In these areas they can move from one habitat patch to another without having to pass through areas that are dangerously warm for them.
The fact that pikas have also adapted to a number of marginal, hot environments suggests to me that they are more resilient to climate change than many past studies have concluded. Most species exhibit losses near the edges of their geographical ranges, simply because individual animals in those zones are living in conditions that are less than ideal for them. This does not mean that they are going extinct.
Climate change is the most critical issue facing the world today, so it is particularly important that scientists communicate accurately about it to the public. In my view, the fact that pikas are coping and altering their behaviors in response to changing conditions is encouraging news for future naturalists setting out to observe one of nature's most charismatic mammals.
Andrew Smith is a professor emeritus of life sciences at Arizona State University.
Disclosure statement: Andrew Smith does not work for, consult, own shares in or receive funding from any company or organization that would benefit from this article, and has disclosed no relevant affiliations beyond his academic appointment.
Reposted with permission from The Conversation.
New USPS Fleet to Include Some Electric Vehicles, Some Gas With Electric Retrofit Potential
The Postal Service is updating its massive fleet of mail carrying vehicles, heralding a significant step toward reducing carbon pollution from its massive fleet while also helping to protect its workforce from climate impacts.
- Texas Blackouts Reveal How Electric Vehicles Can Provide Power ... ›
- Ask a Scientist: Electric Vehicles are the Cleanest Option Today ... ›
EcoWatch Daily Newsletter
After a second day of Senate hearings, Representative Deb Haaland (D-NM) is poised to become the first Native to serve as Secretary of the Interior (or any such high-ranking cabinet position.)
- Joe Biden Appoints Climate Crisis Team - EcoWatch ›
- Democrats Unveil Bill Addressing Cultural Genocide Against Native ... ›
- Biden Taps Rep. Deb Haaland to Lead Interior in Historic Move ... ›
Trending
A rare yellow penguin has been photographed for what is believed to be the first time.
- World-Renowned Photographer Documents Most Remote ... ›
- This Penguin Colony Has Fallen by 77% on Antarctic Islands ... ›
By Stuart Braun
We spend 90% of our time in the buildings where we live and work, shop and conduct business, in the structures that keep us warm in winter and cool in summer.
But immense energy is required to source and manufacture building materials, to power construction sites, to maintain and renew the built environment. In 2019, building operations and construction activities together accounted for 38% of global energy-related CO2 emissions, the highest level ever recorded.
- Could IKEA's New Tiny House Help Fight the Climate Crisis ... ›
- Los Angeles City-Owned Buildings to Go 100% Carbon Free ... ›
- New Jersey Will Be First State to Require Building Permits to ... ›
By Eric Tate and Christopher Emrich
Disasters stemming from hazards like floods, wildfires, and disease often garner attention because of their extreme conditions and heavy societal impacts. Although the nature of the damage may vary, major disasters are alike in that socially vulnerable populations often experience the worst repercussions. For example, we saw this following Hurricanes Katrina and Harvey, each of which generated widespread physical damage and outsized impacts to low-income and minority survivors.
Mapping Social Vulnerability
<p>Figure 1a is a typical map of social vulnerability across the United States at the census tract level based on the Social Vulnerability Index (SoVI) algorithm of <a href="https://onlinelibrary.wiley.com/doi/abs/10.1111/1540-6237.8402002" target="_blank"><em>Cutter et al.</em></a> [2003]. Spatial representation of the index depicts high social vulnerability regionally in the Southwest, upper Great Plains, eastern Oklahoma, southern Texas, and southern Appalachia, among other places. With such a map, users can focus attention on select places and identify population characteristics associated with elevated vulnerabilities.</p>Fig. 1. (a) Social vulnerability across the United States at the census tract scale is mapped here following the Social Vulnerability Index (SoVI). Red and pink hues indicate high social vulnerability. (b) This bivariate map depicts social vulnerability (blue hues) and annualized per capita hazard losses (pink hues) for U.S. counties from 2010 to 2019.
<p>Many current indexes in the United States and abroad are direct or conceptual offshoots of SoVI, which has been widely replicated [e.g., <a href="https://link.springer.com/article/10.1007/s13753-016-0090-9" target="_blank"><em>de Loyola Hummell et al.</em></a>, 2016]. The U.S. Centers for Disease Control and Prevention (CDC) <a href="https://www.atsdr.cdc.gov/placeandhealth/svi/index.html" target="_blank">has also developed</a> a commonly used social vulnerability index intended to help local officials identify communities that may need support before, during, and after disasters.</p><p>The first modeling and mapping efforts, starting around the mid-2000s, largely focused on describing spatial distributions of social vulnerability at varying geographic scales. Over time, research in this area came to emphasize spatial comparisons between social vulnerability and physical hazards [<a href="https://doi.org/10.1007/s11069-009-9376-1" target="_blank"><em>Wood et al.</em></a>, 2010], modeling population dynamics following disasters [<a href="https://link.springer.com/article/10.1007%2Fs11111-008-0072-y" target="_blank" rel="noopener noreferrer"><em>Myers et al.</em></a>, 2008], and quantifying the robustness of social vulnerability measures [<a href="https://doi.org/10.1007/s11069-012-0152-2" target="_blank" rel="noopener noreferrer"><em>Tate</em></a>, 2012].</p><p>More recent work is beginning to dissolve barriers between social vulnerability and environmental justice scholarship [<a href="https://doi.org/10.2105/AJPH.2018.304846" target="_blank" rel="noopener noreferrer"><em>Chakraborty et al.</em></a>, 2019], which has traditionally focused on root causes of exposure to pollution hazards. Another prominent new research direction involves deeper interrogation of social vulnerability drivers in specific hazard contexts and disaster phases (e.g., before, during, after). Such work has revealed that interactions among drivers are important, but existing case studies are ill suited to guiding development of new indicators [<a href="https://doi.org/10.1016/j.ijdrr.2015.09.013" target="_blank" rel="noopener noreferrer"><em>Rufat et al.</em></a>, 2015].</p><p>Advances in geostatistical analyses have enabled researchers to characterize interactions more accurately among social vulnerability and hazard outcomes. Figure 1b depicts social vulnerability and annualized per capita hazard losses for U.S. counties from 2010 to 2019, facilitating visualization of the spatial coincidence of pre‑event susceptibilities and hazard impacts. Places ranked high in both dimensions may be priority locations for management interventions. Further, such analysis provides invaluable comparisons between places as well as information summarizing state and regional conditions.</p><p>In Figure 2, we take the analysis of interactions a step further, dividing counties into two categories: those experiencing annual per capita losses above or below the national average from 2010 to 2019. The differences among individual race, ethnicity, and poverty variables between the two county groups are small. But expressing race together with poverty (poverty attenuated by race) produces quite different results: Counties with high hazard losses have higher percentages of both impoverished Black populations and impoverished white populations than counties with low hazard losses. These county differences are most pronounced for impoverished Black populations.</p>Fig. 2. Differences in population percentages between counties experiencing annual per capita losses above or below the national average from 2010 to 2019 for individual and compound social vulnerability indicators (race and poverty).
<p>Our current work focuses on social vulnerability to floods using geostatistical modeling and mapping. The research directions are twofold. The first is to develop hazard-specific indicators of social vulnerability to aid in mitigation planning [<a href="https://doi.org/10.1007/s11069-020-04470-2" target="_blank" rel="noopener noreferrer"><em>Tate et al.</em></a>, 2021]. Because natural hazards differ in their innate characteristics (e.g., rate of onset, spatial extent), causal processes (e.g., urbanization, meteorology), and programmatic responses by government, manifestations of social vulnerability vary across hazards.</p><p>The second is to assess the degree to which socially vulnerable populations benefit from the leading disaster recovery programs [<a href="https://doi.org/10.1080/17477891.2019.1675578" target="_blank" rel="noopener noreferrer"><em>Emrich et al.</em></a>, 2020], such as the Federal Emergency Management Agency's (FEMA) <a href="https://www.fema.gov/individual-disaster-assistance" target="_blank" rel="noopener noreferrer">Individual Assistance</a> program and the U.S. Department of Housing and Urban Development's Community Development Block Grant (CDBG) <a href="https://www.hudexchange.info/programs/cdbg-dr/" target="_blank" rel="noopener noreferrer">Disaster Recovery</a> program. Both research directions posit social vulnerability indicators as potential measures of social equity.</p>