
 568k
568k  233k
233k  41k
41k  Subscribe

By Ted Auch
Now that we as a nation have weathered another silly season’s worth of campaign ads, lawn signs and less than insightful debates between the country’s two—and in the case of Vermont’s gubernatorial election, seven—parties; it is time to get down to the job of governing this fine country and finding potential legislation that everyone can agree upon.
However, this will come with numerous attempts to abrogate U.S. Environmental Protection Agency (EPA) regulations to cut greenhouse gas (GHG) emissions via the Congressional Review Act, investigations and defunding lead by likely chair of the Senate Environment and Public Works Committee James M. “The Greatest Hoax” Inhofe (R-OK). Enter stage right the Keystone XL pipeline and statements like these from the GOP leadership and former Obama officials:
“We can act on the Keystone pipeline,” said House Speaker John Boehner (R-OH).
“When you say energy these days, people think of the Keystone pipeline … I mean, the employment figures connected with Keystone are stunning if we would just get going. [And I will] try to do whatever I can to get the EPA reined in,” said Senate majority leader, Mitch McConnell (R-KY).
“If Republicans attach Keystone to a budget bill, I don’t think he’s so principally opposed to it that he would veto it,” stated Former Obama State Department Bureau of Energy Resources lead David Goldwyn.
As anyone reading this knows by now, the Keystone XL is a highly controversial—but just one of many—proposal to create a N-NW to S-SW pipeline connector to the existing Keystone across Montana, South Dakota, the SW corner of North Dakota and Nebraska. The proposal would connect with the existing Keystone 55-60 miles southwest of Lincoln, Nebraska. This proposal is contentious for many reasons, one of which is the fact that it would cut across Nebraska’s Sand Hills, Kansas’ Flint Hills, and the region’s Great and Glaciated Plains natural area sand sit just above the shallow 174,000 square miles of the Ogallala Aquifer, which provides drinking water to 1.9 million people and irrigation to 27 percent of the arable land in the U.S.
Bipartisan Points of Interest
As soon as it was obvious at around 10:30 p.m. EST that there would be a sea change in DC with the GOP ousting floundering DNC incumbents or challengers, both sides turned to potential points of compromise with topics like immigration, tweaking Obamacare at the margins, etc. receiving quite a bit of air time. Top among these is revisiting the Keystone XL expansion as the ultimate olive branch the administration could offer to its friends across the aisle. It is worth noting that as our politicians continue to debate the science of climate change and do all they can to ramp up our already disproportionate reliance on fossil fuels across the pond, the political consensus in countries like Denmark and Germany is nearly unanimous that their energy portfolios should exceed 50 percent by 2020.
Both parties have their boutique or “go-to” studies supporting their point of view as it relates to Keystone XL job multiplier, oil production and environmental cost-benefit analyses but very few, if any, have analyzed the past, current and potential footprint of the Athabasca and Peace River Oil Sands as it relates to above- and below-ground ecosystem service loss resulting from land-use/land-cover (LULC) change. Even the province of Alberta presents an ESRI online map of current and proposed oil sands projects. Alberta oil sands has increased by 1,455 percent from its early annual averages of 50 Million Barrels (MBs) to its current annual average of 725+ (Figure 1).

Just like similar fossil fuel and related industries’ activities (i.e. frack sand mining and freshwater withdrawals), oil sands production has reached an exponential inflection point which shows no signs of slowing and likely is accelerating with calls for “energy independence,” OPEC “foreign radicals,” and the seemingly insatiable appetite for energy in developed countries as well as the growing affluence of countries like Brazil, Russia, India and China (aka Goldman Sachs’ BRICs)[1]. The increasingly conservative and fossil fuel-infatuated Canadian government lead by Stephen Harper has already put all its eggs in the oils sands’ basket as a primary overseas export engine of GDP growth. Harper & Co. are not waiting for DC to get its Keystone house in order with their Saint John, New Brunswick Energy East pipeline proposal which we have documented here and here. But make no mistake. Decisions made in the coming months and years in DC will dramatically influence the rate of oil sand expansion in Alberta. And with the winds pointing in the direction of Keystone approval, it is imperative that we understand how much oil sands LULC change has degraded ecosystem services and how it may change in the future under a variety of scenarios.
Current and Potential State of Ecosystem Service Loss in Alberta Oil Sands
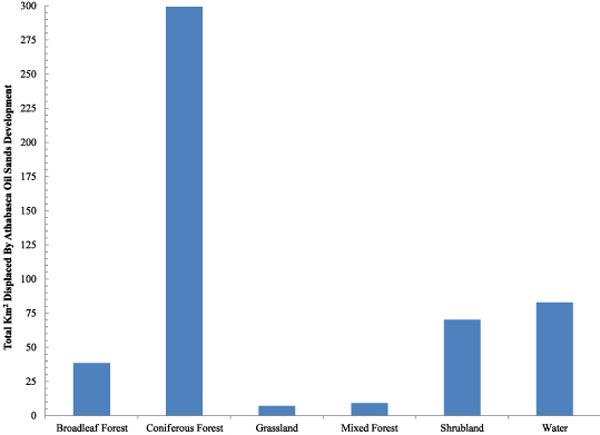
The ecosystems that have been most effected by the recent oil sands expansion are coniferous forests and myriad shrublands to the tune of 370+ square kilometers followed by 39 square kilometers of deciduous forest and the shrinkage of freshwater area by 83 square kilometers. Additionally, recent oil sand expansion has displaced 16 square kilometers of grassland and mixed forest coverage. Mined area constituted 16.4 percent of the area under consideration historically vs. 61.1 percent of the land area under the most recent expansion. The point here is that the more recent expansion has left very little native vegetation, while prior efforts were more diffuse and smaller with more extensive tracts of native ecosystems left intact. Putting a finer point on this, we see that exposed area broadly defined constitutes 61.4 percent of oil sands’ recent expansion and 24.2 percent of the older efforts. Tailing ponds constituted 7.9 percent of the old oil sands footprint and <00.05 percent of the most recent expansion.
The total area exploited to date for oil sands is somewhere between 750 and 779 square kilometers with roughly 38 percent of the original 35,846 acres of freshwater remaining. Additionally, there is only 26 percent of the native vegetation left within what we will call the “actual footprint” (i.e. the northern, southern, eastern and westernmost points of activity), which extends to 2.46 times the aforementioned 750-778 square kilometers range at approximately 4,786 square kilometers. Native vegetation is spread across 1,000+ polygons averaging 48.4 acres and totaling 199 square kilometers.
Put another way, the total potential Athabasca footprint spread across 53 unique polygons totals 71,878 square kilometers—meaning the percent that has been physically exploited to date accounts for 1.1 percent of the available area and the “actual footprint” comes in at around 6.7 percent of the potential. Translation: the calculations we present here for ecosystem loss are just the tip of the iceberg if Canadian and Chinese officials, as well as, our congress get their way with respect to the Keystone XL expansion.

Model Parameters
In order to get to the following estimates, we assumed the average Alberta native sub-arctic ecosystem produces 8,510-13,680 kilograms per hectare (kgs per ha) (3.8-6.1 tons per acre) of aboveground biomass, 4,810-7,020 kgs per ha (2.2-3.1 tons per acre) of soil carbon, and 1,870-2,800 kgs per ha (0.8-1.2 tons per acre) of root biomass each year and each hectare was home to 251,810-261,250 kgs (112-116 tons per acre) of soil carbon (Kurz et al., 2013).
Current and Past Oil Sands Exploitation
Below we present ecosystem loss in terms of tons of carbon dioxide (CO2), Per Capita Equivalents and in terms of U.S. dollars, assuming $5 and $75 per ton of CO2:
- Old and Recent Expansion
- 45.07 million tons (MT) of CO2 (8.9 Teragrams (Tg) CO2)
- 2.5 million per capita emissions equivalents (MPCEE), which is nearly the population of Chicago or Toronto
- A price of $204.18 million to $3.38 billion
- Assuming the average northern Alberta ecosystem burns every 20-21 years clearing all aboveground biomass, the above translates into:
- 918.79 MT of CO2 (181.7 Teragrams (Tg) CO2 or 13.3 percent of annual U.S. emissions from burning fossil fuels)
- 51.2 MPCEE
- $4.16-68.91 billion (The same multiplier could potentially be applied to the calculations below)
- Assuming the average northern Alberta ecosystem burns every 20-21 years clearing all aboveground biomass, the above translates into:
- Actual Footprint
- 357.8 MT of CO2
- 19.9 MPCEE, which is equal to the combined population of Mexico City, New York and Los Angeles
- A price of $1.62 to $28.84 billion
Future Scenarios
Ten year Alberta oil sands scenario across three rates of productivity increases:
- Total Athabasca and Piece River Exploited:
- 6.93 billion tons (BT) of CO2 (1,369.4 Teragrams (Tg) CO2 or 100 percent of annual U.S. emissions from burning fossil fuels)[2]
- 385.8 MPCEE or the combined population of the U.S., Canada and Saudi Arabia
- A price of $31.37 to $519.34 billion, which is equal to the GDP of North Dakota and Norway, respectively
- Production increases at a rate of 5.8 percent (i.e. 2nd quartile rate of change):
- 71.37 MT of CO2
- 4.0 MPCEE or the entire population of Los Angeles
- A price of $323.29 million to $5.35 billion
- Production increases at a rate of 23.9 percent (i.e. 3rd quartile rate of change):
- 159.93 MT of CO2
- 8.5 MPCEE (i.e. Mexico City)
- A price of $692.79 million to $11.47 billion.
- Production increases at a rate of 76.9 percent (i.e. 4th quartile rate of change):
- 391.76 MT of CO2
- 21.8 MPCEE
- A price of $1.77 to $29.38 billion with the latter ironically being equal to the GDP of North Dakota.
Future Steps and Potential Ramifications
The Total Athabasca and Piece River exploitation scenario outlined above amounts to 4.3 percent of global CO2 emissions from the burning of fossil fuels. And if we assume the aforementioned 20-21 year fire interval, this would amount to 87.8 percent of global annual emissions—an extremely disturbing number given that we have already surpassed 350.org and Jim Hansen’s proposed atmospheric concentration tipping points at a rate of 1.02 percent per year with exploitation of the Alberta oil sands likely to amplify this rate of change in parallel with the above results.
Finally, this is not just a story about CO2, but also two other primary GHGs: CH4 and N2O. If we assume a reasonably constant ratio of CO2 to these GHGs [3]—which is admittedly a gross oversimplification given the large amounts of CH4 and N2O currently being emitted from melting permafrost soils—these rates of CO2 emissions will be accompanied by 481.8 TG worth of annual CH4 and N2O emissions or a fire interval value of 9,821.6 Tg which would add an additional 7.2 years worth of U.S. fossil fuels emissions equivalents to the atmosphere.
So before we decide to give carte blanche to the big players in the Athabasca and the folks at TransCanada, it will be important to discuss frankly and empirically what an atmosphere enriched with the above would mean for our way of life in the long-term rather than simply focusing on short-term royalty and ephemeral job multiplier numbers presented by industry and the politicians they have long been supporting financially.
The way U.S. and Canadian politicians and industry have been promoting the Keystone XL and Athabasca Oil Sands is equivalent to you or I assuming that we are balancing our checkbook if we keep scrupulous records of deposits, but only occasionally if ever, address withdrawals. That is no way to balance our personal finances or this planet’s environmental finances (in my humble opinion). The long-term externality costs associated with the Keystone XL expansion are largely environmental in nature and will be socialized, while the short-term financial windfall profits will be privatized. It is going to be important to incorporate the costs described above into our planetary checkbook analogy.
[1] State owned Petro-China recently took a 60 percent claim in two oil sands projects which is its largest extra-territorial investment to date according to the The National Post.
[2] Keep in mind the vegetation in this region is cleared by fire every 20-21 years meaning this 1,369.4 Tg is actually more like 27,914.1 Tg if we assume a constant rate of biomass accrual. The latter figure is nearly equal to 20.5 years of U.S. CO2 emissions from the burning of fossil fuels.
[3] As well as global warming potentials relative to CO2 of 21 and 310 for CH4 and N2O, respectively.
YOU MIGHT ALSO LIKE
5 Reasons Senate Must Reject the Keystone XL Pipeline