
 568k
568k  233k
233k  41k
41k  Subscribe
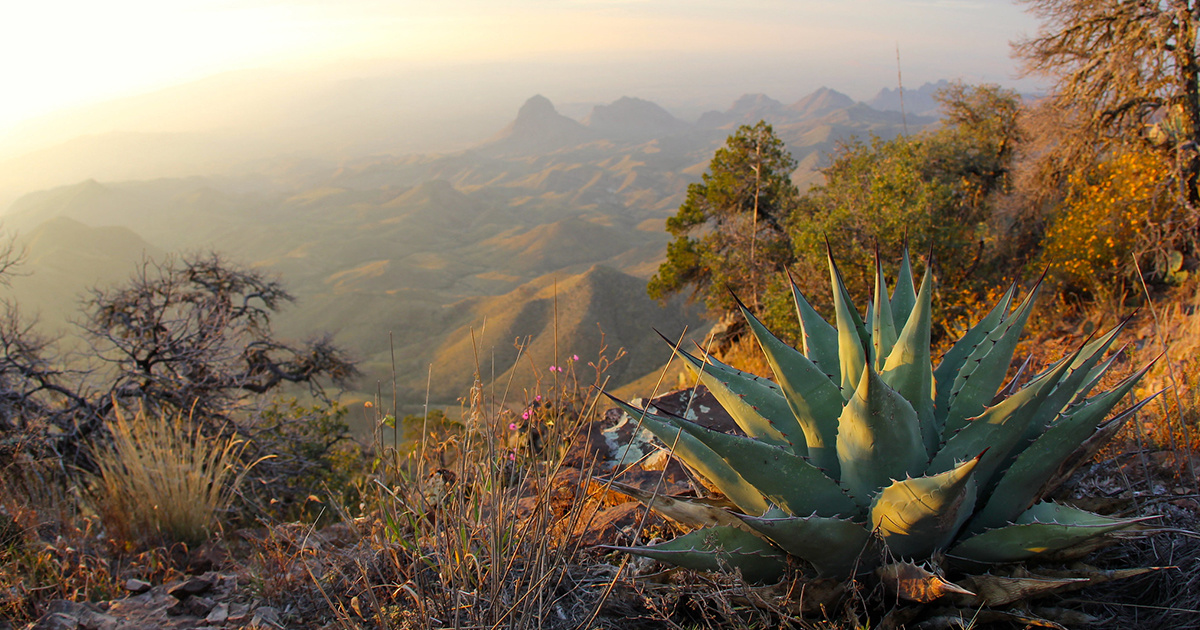
A few days every year, air pollution at Big Bend National Park causes some of the worst air quality in terms of visible impairment at any park. daveynin / CC BY-2.0
Ninety-six percent of America’s national parks have significant air pollution issues ranging from unhealthy breathing conditions to contaminated soils and waterways, according to a new report released by the National Parks Conservation Association (NPCA).
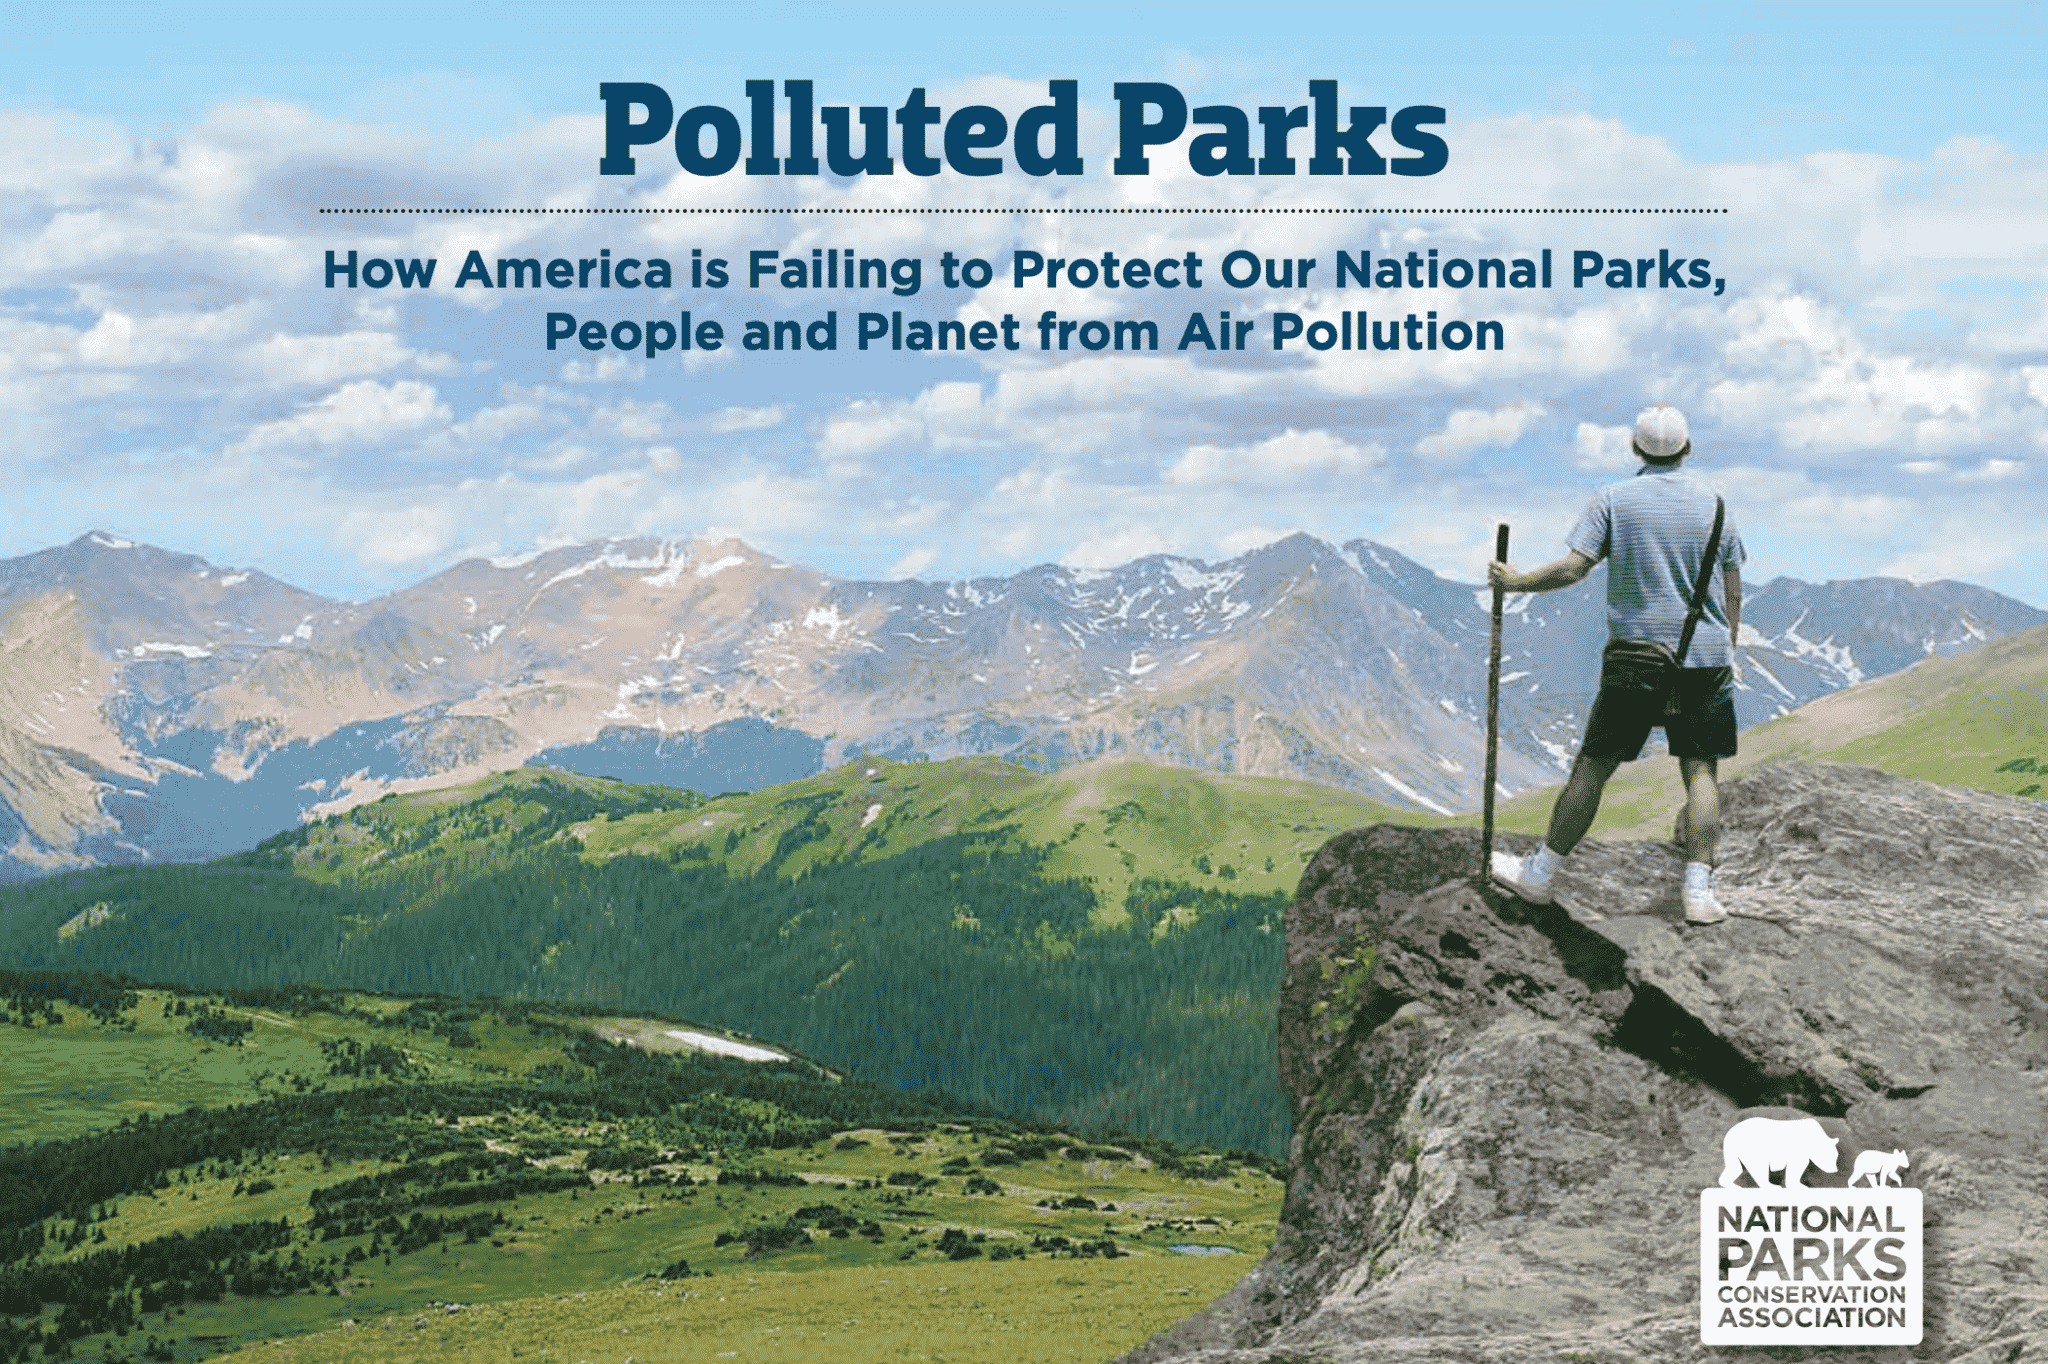
“When people think of iconic parks like Joshua Tree or the Grand Canyon, they think of unspoiled landscapes and scenic views. I think they would be shocked to know that these are actually some of our most polluted national parks,” said NPCA President and CEO Theresa Pierno.
Data compiled by the National Park Service was analyzed in order to evaluate more than 400 parks in four categories: harm imposed on nature, hazy skies, unhealthy air and climate change. Each park was ranked based as significant, moderate or little to no concern. Researchers found that 85 percent of parks have air that is unhealthy to breathe while almost 90 percent of parks suffer from either haze pollution or soil and water pollution that negatively impacts sensitive species and habitats. Moreover, climate change was dubbed a significant concern for 80 percent of national parks, though all will be affected to some degree in the coming years.
Unhealthy air that may pose negative effects on health was observed at 354 parks, 87 of which exhibited ozone levels of significant concern. Similarly, a 2018 study found that many national parks had similar ozone values to 20 of the largest major cities in the U.S. between 1990 and 2014. For example, Northern California’s Sequoia National Park compared to Los Angeles for days when the air was considered “unhealthy for sensitive groups” by the U.S. Environmental Protection Agency (EPA).
“Air pollution is also posing a health risk to some of the 330 million people who visit our parks each year, as well as the communities who surround them,” Pierno said. “The challenges facing our parks are undeniable, but so is our resolve to help clear their air and ensure they are protected as they were meant to be, by both their founders and by the laws in place to protect them.”
Hazy skies documented at 370 parks of moderate or significant concern cause the average national park visitor to miss out on an estimated 50 miles of scenery. This has been seen at parks around the country, such as Big Bend National Park in Texas. A few days every year, air pollution here causes some of the worst air quality in terms of visible impairment at any park, reducing the visibility to less than 30 miles 6 percent of the time, according to the National Park Service.
Most air pollution does not originate in parks but is capable of traveling hundreds of miles through the wind, bringing with it deposits of nitrogen and sulfur compounds to even the most remote ones, particularly in the face of increasing greenhouse gas emissions. Harm to sensitive species and habitat was observed in 368 parks seeing artificially enriched soils and acidifying water systems. Ecosystems in the Rocky Mountains, Cascades and Sierra Nevada are particularly sensitive to increased nitrogen to the point that the NPS has developed a monitoring program dedicated to such measures.
Climate change is considered a significant concern because of increases in temperature, precipitation and early onset spring. According to the U.S. Geological Survey, Glacier National Park in Montana is experiencing some of the biggest impacts as many of its namesake glaciers are melting or have already disappeared because of such extremes.
- 5 Ways Trump Is 'Gaslighting' Us on U.S. Air Pollution Levels ...
- Air Pollution in National Parks as Bad as 20 Largest U.S. Cities ...