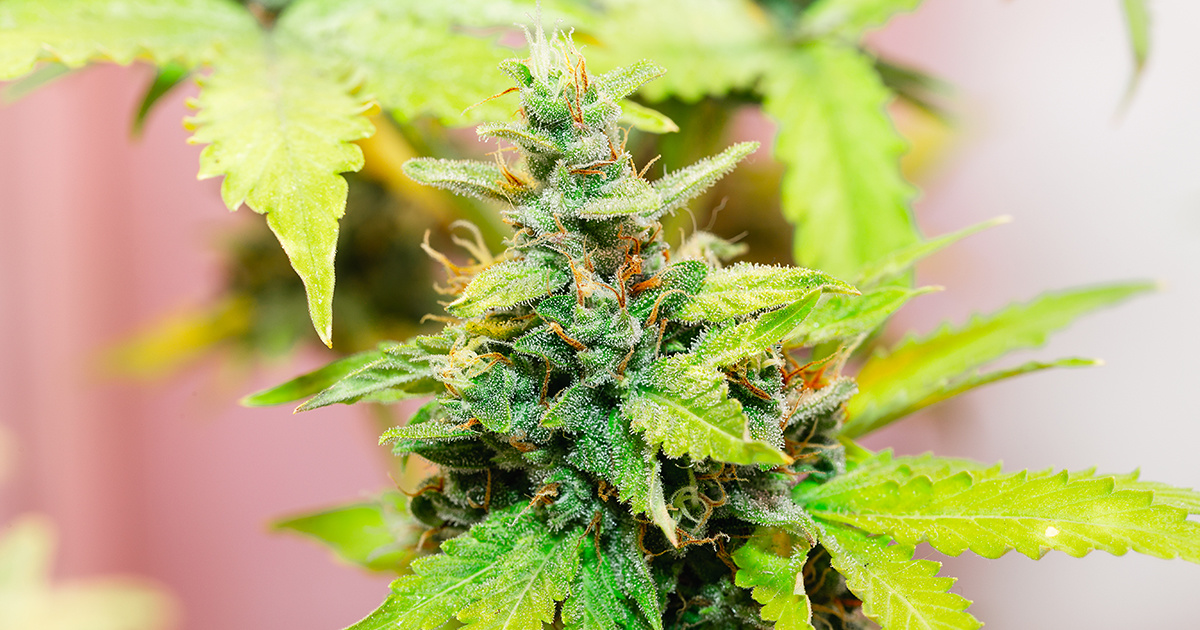
Marijuana Is More Than Just THC: A Look at the Untapped Healing Compounds

By James David Adams
Medical marijuana is legal in 33 states as of November 2018. Yet the federal government still insists marijuana has no legal use and is easy to abuse. In the meantime, medical marijuana dispensaries have an increasing array of products available for pain, anxiety, sex and more.
The glass counters and their jars of products in the dispensary resemble an 18th century pharmacy. Many strains for sale have evocative and magical names like Blue Dream, Bubba Kush and Chocolope. But what does it all mean? Are there really differences in the medical qualities of the various strains? Or, are the different strains with the fanciful names all just advertising gimmicks?
I am a professor in the University of Southern California School of Pharmacy. I have lived in California a long time and remember the Haight-Ashbury Summer of Love. While in graduate school, I worked with Prof. Alexander Shulgin, the father of designer drugs, who taught me the chemistry of medicinal plants. Afterwards, while a professor at USC, I learned Chumash healing from a Native American Chumash healer for 14 years from 1998 until 2012. She taught me how to make medicines from Californian plants, but not marijuana, which is not native to the U.S. Currently, I am teaching a course in medical marijuana to pharmacy students.
If there is one thing about marijuana that is certain: In small doses it can boost libido in men and women, leading to more sex. But can marijuana really be used for medical conditions?
What are Cannabinoids?
New research is revealing that marijuana is more than just a source of cannabinoids, chemicals that may bind to cannabinoid receptors in our brains, which are used to get high. The most well-known is tetrahydrocannabinol (THC). Marijuana is a particularly rich source of medicinal compounds that we have only begun to explore. In order to harness the full potential of the compounds in this plant, society needs to overcome misconceptions about marijuana and look at what research clearly says about the medical value.
The FDA has already made some moves in this direction by approving prescription drugs that come from marijuana including dronabinol, nabilone, nabiximols and cannabidiol. Dronabinol and nabilone are cannabinoids that are used for nausea. Nabiximols — which contain THC, the compound most responsible for marijuana's high and cannabidiol, which does not induce a high — are used to treat multiple sclerosis. Cannabidiol, or CBD, is also used to treat some types of epilepsy.
Marijuana, originally from the Altai Mountains in Central and East Asia, contains at least 85 cannabinoids and 27 terpenes, fragrant oils that are produced by many herbs and flowers that may be active, drug-like compounds. THC is the cannabinoid everyone wants in order to get high. It is produced from THC acid — which constitutes up to 25 percent of the plant's dry weight — by smoking or baking any part of the marijuana plant.
THC mimics a naturally occurring neurotransmitter called anandamide that works as a signaling molecule in the brain. Anandamide attaches to proteins in the brain called cannabinoid receptors, which then send signals related to pleasure, memory, thinking, perception and coordination, to name a few. THC works by hijacking these natural cannabinoid receptors, triggering a profound high.
Tetrahydrocannabivarinic acid, another cannabinoid, can constitute up to 10 percent of the dry weight. It is converted to another compound that probably contributes to a high, tetrahydrocannabivarin, when smoked or ingested in baked goods. Potent varieties like Doug's Varin and Tangie may contain even higher concentrations.
Medical Properties of Marijuana
But not all cannabinoids make you high. Cannabidiol, a cannabinoid similar to THC, and its acid are also present in marijuana, especially in certain varieties. But these do not cause euphoria. The cannabidiol molecule interacts with a variety of receptors — including cannabinoid and serotonin receptors and transient receptor potential cation channels (TRP) – to reduce seizures, combat anxiety and produce other effects.
Marijuana also contains several monoterpenoids — small, aromatic molecules — that have a wide range of activities including pain and anxiety relief and that work by inhibiting TRP channels.
Myrcene is the most abundant monoterpenoid, a type or terpene, in marijuana. It can relax muscles. Other terpenes such as pinene, linalool, limonene and the sesquiterpene, beta-caryophyllene are pain relievers, especially when applied directly to the skin as a liniment. Some of these terpenes may add to the high when marijuana is smoked.
What Do All These Varieties Do?
Many different varieties of marijuana are on the market and are alleged to treat a range of diseases. The FDA has no oversight for these claims, since the FDA does not recognize marijuana as a legal product.
Strains of marijuana are grown that produce more THC than cannadidiol or vice versa. Other varieties have abundant monoterpenoids. How do you know that the strain you choose is legitimate with probable medical benefits? Each strain should have a certificate of analysis that shows you how much of each active compound is present in the product you buy. Many states have a bureau of cannabis control that verifies these certificates of analysis. However, many certificates of analysis do not show the monoterpenoids present in the marijuana. The analysis of monoterpenoids is difficult since they evaporate from the plant material. If you are looking for a strain high in myrcene or linalool, ask for proof.
Marijuana can improve several conditions, but it can also make others worse and can have nasty side effects.
As recreational use has become more widespread, marijuana hyperemesis syndrome is becoming more of a problem in our society. Some people vomit uncontrollably after smoking marijuana regularly. It can be treated by rubbing a cream made from capsaicin, from chili peppers, on the abdomen. Capsaicin cream is available in pharmacies.
Also, high THC varieties of marijuana, such as Royal Gorilla and Fat Banana, can cause anxiety and even psychosis in some people.
Researchers have also shown that anxiety can be effectively treated with strains that have more cannabidiol and linalool. It may be best to rub a cannabidiol balm or lotion on your cheeks to relieve anxiety.
Other conditions that studies have shown are improved by marijuana are: cancer induced nausea, Type 2 diabetes, two forms of epilepsy, HIV-induced weight gain, irritable bowel syndrome, migraines, multiple sclerosis, osteoarthritis, rheumatoid arthritis, pain, chronic pain, post-traumatic stress disorder, sleep disorders and traumatic brain injury.
For some of these conditions, studies show that eating or topically applying marijuana products rather than smoking is recommended.
Clearly, more research is needed from the scientific community to help guide the appropriate, safe use of marijuana. However, the FDA does not recognize the use of medical marijuana. This makes funding for research on marijuana difficult to find. Perhaps the cannabis industry should consider funding scientific research on marijuana. But conflicts of interest may become a concern as we have seen with drug company-sponsored studies.
James David Adams is an Associate Professor of Pharmacology and Pharmaceutical Sciences at the University of Southern California.
Reposted with permission from our media associate The Conversation.
- Cannabidiol: Rising Star or Popular Fad? - EcoWatch ›
- 8 Science-Based Benefits of CBD Oil - EcoWatch ›
- A CBD-Infused Sleep 'Cocktail' to Bring on the Zzz's - EcoWatch ›
- Why Can’t Veterans Get Medical Marijiuana for PTSD When People (and Even Dogs) Can in 33 States? - EcoWatch ›
- Marijuana Edibles May Not Be as Safe as Presumed, Doctors Argue - EcoWatch ›
A rare yellow penguin has been photographed for what is believed to be the first time.
- World-Renowned Photographer Documents Most Remote ... ›
- This Penguin Colony Has Fallen by 77% on Antarctic Islands ... ›
EcoWatch Daily Newsletter
By Stuart Braun
We spend 90% of our time in the buildings where we live and work, shop and conduct business, in the structures that keep us warm in winter and cool in summer.
But immense energy is required to source and manufacture building materials, to power construction sites, to maintain and renew the built environment. In 2019, building operations and construction activities together accounted for 38% of global energy-related CO2 emissions, the highest level ever recorded.
- Could IKEA's New Tiny House Help Fight the Climate Crisis ... ›
- Los Angeles City-Owned Buildings to Go 100% Carbon Free ... ›
- New Jersey Will Be First State to Require Building Permits to ... ›
Trending
By Eric Tate and Christopher Emrich
Disasters stemming from hazards like floods, wildfires, and disease often garner attention because of their extreme conditions and heavy societal impacts. Although the nature of the damage may vary, major disasters are alike in that socially vulnerable populations often experience the worst repercussions. For example, we saw this following Hurricanes Katrina and Harvey, each of which generated widespread physical damage and outsized impacts to low-income and minority survivors.
Mapping Social Vulnerability
<p>Figure 1a is a typical map of social vulnerability across the United States at the census tract level based on the Social Vulnerability Index (SoVI) algorithm of <a href="https://onlinelibrary.wiley.com/doi/abs/10.1111/1540-6237.8402002" target="_blank"><em>Cutter et al.</em></a> [2003]. Spatial representation of the index depicts high social vulnerability regionally in the Southwest, upper Great Plains, eastern Oklahoma, southern Texas, and southern Appalachia, among other places. With such a map, users can focus attention on select places and identify population characteristics associated with elevated vulnerabilities.</p>Fig. 1. (a) Social vulnerability across the United States at the census tract scale is mapped here following the Social Vulnerability Index (SoVI). Red and pink hues indicate high social vulnerability. (b) This bivariate map depicts social vulnerability (blue hues) and annualized per capita hazard losses (pink hues) for U.S. counties from 2010 to 2019.
<p>Many current indexes in the United States and abroad are direct or conceptual offshoots of SoVI, which has been widely replicated [e.g., <a href="https://link.springer.com/article/10.1007/s13753-016-0090-9" target="_blank"><em>de Loyola Hummell et al.</em></a>, 2016]. The U.S. Centers for Disease Control and Prevention (CDC) <a href="https://www.atsdr.cdc.gov/placeandhealth/svi/index.html" target="_blank">has also developed</a> a commonly used social vulnerability index intended to help local officials identify communities that may need support before, during, and after disasters.</p><p>The first modeling and mapping efforts, starting around the mid-2000s, largely focused on describing spatial distributions of social vulnerability at varying geographic scales. Over time, research in this area came to emphasize spatial comparisons between social vulnerability and physical hazards [<a href="https://doi.org/10.1007/s11069-009-9376-1" target="_blank"><em>Wood et al.</em></a>, 2010], modeling population dynamics following disasters [<a href="https://link.springer.com/article/10.1007%2Fs11111-008-0072-y" target="_blank" rel="noopener noreferrer"><em>Myers et al.</em></a>, 2008], and quantifying the robustness of social vulnerability measures [<a href="https://doi.org/10.1007/s11069-012-0152-2" target="_blank" rel="noopener noreferrer"><em>Tate</em></a>, 2012].</p><p>More recent work is beginning to dissolve barriers between social vulnerability and environmental justice scholarship [<a href="https://doi.org/10.2105/AJPH.2018.304846" target="_blank" rel="noopener noreferrer"><em>Chakraborty et al.</em></a>, 2019], which has traditionally focused on root causes of exposure to pollution hazards. Another prominent new research direction involves deeper interrogation of social vulnerability drivers in specific hazard contexts and disaster phases (e.g., before, during, after). Such work has revealed that interactions among drivers are important, but existing case studies are ill suited to guiding development of new indicators [<a href="https://doi.org/10.1016/j.ijdrr.2015.09.013" target="_blank" rel="noopener noreferrer"><em>Rufat et al.</em></a>, 2015].</p><p>Advances in geostatistical analyses have enabled researchers to characterize interactions more accurately among social vulnerability and hazard outcomes. Figure 1b depicts social vulnerability and annualized per capita hazard losses for U.S. counties from 2010 to 2019, facilitating visualization of the spatial coincidence of pre‑event susceptibilities and hazard impacts. Places ranked high in both dimensions may be priority locations for management interventions. Further, such analysis provides invaluable comparisons between places as well as information summarizing state and regional conditions.</p><p>In Figure 2, we take the analysis of interactions a step further, dividing counties into two categories: those experiencing annual per capita losses above or below the national average from 2010 to 2019. The differences among individual race, ethnicity, and poverty variables between the two county groups are small. But expressing race together with poverty (poverty attenuated by race) produces quite different results: Counties with high hazard losses have higher percentages of both impoverished Black populations and impoverished white populations than counties with low hazard losses. These county differences are most pronounced for impoverished Black populations.</p>Fig. 2. Differences in population percentages between counties experiencing annual per capita losses above or below the national average from 2010 to 2019 for individual and compound social vulnerability indicators (race and poverty).
<p>Our current work focuses on social vulnerability to floods using geostatistical modeling and mapping. The research directions are twofold. The first is to develop hazard-specific indicators of social vulnerability to aid in mitigation planning [<a href="https://doi.org/10.1007/s11069-020-04470-2" target="_blank" rel="noopener noreferrer"><em>Tate et al.</em></a>, 2021]. Because natural hazards differ in their innate characteristics (e.g., rate of onset, spatial extent), causal processes (e.g., urbanization, meteorology), and programmatic responses by government, manifestations of social vulnerability vary across hazards.</p><p>The second is to assess the degree to which socially vulnerable populations benefit from the leading disaster recovery programs [<a href="https://doi.org/10.1080/17477891.2019.1675578" target="_blank" rel="noopener noreferrer"><em>Emrich et al.</em></a>, 2020], such as the Federal Emergency Management Agency's (FEMA) <a href="https://www.fema.gov/individual-disaster-assistance" target="_blank" rel="noopener noreferrer">Individual Assistance</a> program and the U.S. Department of Housing and Urban Development's Community Development Block Grant (CDBG) <a href="https://www.hudexchange.info/programs/cdbg-dr/" target="_blank" rel="noopener noreferrer">Disaster Recovery</a> program. Both research directions posit social vulnerability indicators as potential measures of social equity.</p>Social Vulnerability as a Measure of Equity
<p>Given their focus on social marginalization and economic barriers, social vulnerability indicators are attracting growing scientific interest as measures of inequity resulting from disasters. Indeed, social vulnerability and inequity are related concepts. Social vulnerability research explores the differential susceptibilities and capacities of disaster-affected populations, whereas social equity analyses tend to focus on population disparities in the allocation of resources for hazard mitigation and disaster recovery. Interventions with an equity focus emphasize full and equal resource access for all people with unmet disaster needs.</p><p>Yet newer studies of inequity in disaster programs have documented troubling disparities in income, race, and home ownership among those who <a href="https://eos.org/articles/equity-concerns-raised-in-federal-flood-property-buyouts" target="_blank">participate in flood buyout programs</a>, are <a href="https://www.eenews.net/stories/1063477407" target="_blank" rel="noopener noreferrer">eligible for postdisaster loans</a>, receive short-term recovery assistance [<a href="https://doi.org/10.1016/j.ijdrr.2020.102010" target="_blank" rel="noopener noreferrer"><em>Drakes et al.</em></a>, 2021], and have <a href="https://www.texastribune.org/2020/08/25/texas-natural-disasters--mental-health/" target="_blank" rel="noopener noreferrer">access to mental health services</a>. For example, a recent analysis of federal flood buyouts found racial privilege to be infused at multiple program stages and geographic scales, resulting in resources that disproportionately benefit whiter and more urban counties and neighborhoods [<a href="https://doi.org/10.1177/2378023120905439" target="_blank" rel="noopener noreferrer"><em>Elliott et al.</em></a>, 2020].</p><p>Investments in disaster risk reduction are largely prioritized on the basis of hazard modeling, historical impacts, and economic risk. Social equity, meanwhile, has been far less integrated into the considerations of public agencies for hazard and disaster management. But this situation may be beginning to shift. Following the adage of "what gets measured gets managed," social equity metrics are increasingly being inserted into disaster management.</p><p>At the national level, FEMA has <a href="https://www.fema.gov/news-release/20200220/fema-releases-affordability-framework-national-flood-insurance-program" target="_blank">developed options</a> to increase the affordability of flood insurance [Federal Emergency Management Agency, 2018]. At the subnational scale, Puerto Rico has integrated social vulnerability into its CDBG Mitigation Action Plan, expanding its considerations of risk beyond only economic factors. At the local level, Harris County, Texas, has begun using social vulnerability indicators alongside traditional measures of flood risk to introduce equity into the prioritization of flood mitigation projects [<a href="https://www.hcfcd.org/Portals/62/Resilience/Bond-Program/Prioritization-Framework/final_prioritization-framework-report_20190827.pdf?ver=2019-09-19-092535-743" target="_blank" rel="noopener noreferrer"><em>Harris County Flood Control District</em></a>, 2019].</p><p>Unfortunately, many existing measures of disaster equity fall short. They may be unidimensional, using single indicators such as income in places where underlying vulnerability processes suggest that a multidimensional measure like racialized poverty (Figure 2) would be more valid. And criteria presumed to be objective and neutral for determining resource allocation, such as economic loss and cost-benefit ratios, prioritize asset value over social equity. For example, following the <a href="http://www.cedar-rapids.org/discover_cedar_rapids/flood_of_2008/2008_flood_facts.php" target="_blank" rel="noopener noreferrer">2008 flooding</a> in Cedar Rapids, Iowa, cost-benefit criteria supported new flood protections for the city's central business district on the east side of the Cedar River but not for vulnerable populations and workforce housing on the west side.</p><p>Furthermore, many equity measures are aspatial or ahistorical, even though the roots of marginalization may lie in systemic and spatially explicit processes that originated long ago like redlining and urban renewal. More research is thus needed to understand which measures are most suitable for which social equity analyses.</p>Challenges for Disaster Equity Analysis
<p>Across studies that quantify, map, and analyze social vulnerability to natural hazards, modelers have faced recurrent measurement challenges, many of which also apply in measuring disaster equity (Table 1). The first is clearly establishing the purpose of an equity analysis by defining characteristics such as the end user and intended use, the type of hazard, and the disaster stage (i.e., mitigation, response, or recovery). Analyses using generalized indicators like the CDC Social Vulnerability Index may be appropriate for identifying broad areas of concern, whereas more detailed analyses are ideal for high-stakes decisions about budget allocations and project prioritization.</p>Wisconsin will end its controversial wolf hunt early after hunters and trappers killed almost 70 percent of the state's quota in the hunt's first 48 hours.
By Jessica Corbett
Sen. Bernie Sanders on Tuesday was the lone progressive to vote against Tom Vilsack reprising his role as secretary of agriculture, citing concerns that progressive advocacy groups have been raising since even before President Joe Biden officially nominated the former Obama administration appointee.