
 568k
568k  233k
233k  41k
41k  Subscribe
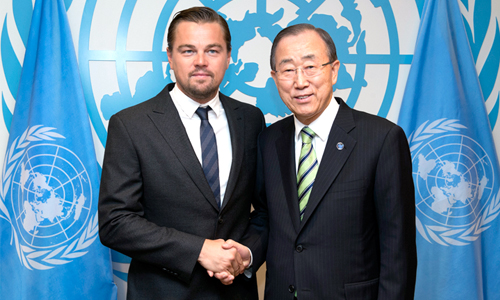
Leonardo DiCaprio’s address to the United Nations at the Paris climate agreement signing ceremony in New York City on April 22.
Thank you, Mr. Secretary General, for the honor to address this body once more. And thanks to the distinguished climate leaders assembled here today who are ready to take action.

President Abraham Lincoln was also thinking of bold action 150 years ago when he said:
“The dogmas of the quiet past are inadequate to the stormy present. As our case is new so we must think anew and act anew. We must disenthrall ourselves and then we shall save our country.”
He was speaking before the U.S. Congress to confront the defining issue of his time—slavery.
Everyone knew it had to end but no one had the political will to stop it. Remarkably, his words ring as true today when applied to the defining crisis of our time— climate change.
As a UN Messenger of Peace, I have been traveling all over the world for the last two years documenting how this crisis is changing the natural balance of our planet. I have seen cities like Beijing choked by industrial pollution. Ancient Boreal forests in Canada that have been clear cut and rainforests in Indonesia that have been incinerated. In India I met farmers whose crops have literally been washed away by historic flooding. In America I have witnessed unprecedented
There is no doubt in the world’s scientific community that this a direct result of human activity and that the effects of climate change will become astronomically worse in the future.
I do not need to throw statistics at you. You know them better than I do, and more importantly, you know what will happen if this scourge is left unchecked. You know that climate change is happening faster than even
Now think about the shame that each of us will carry when our children and grandchildren look back and realize that we had the means of stopping this devastation, but simply lacked the political will to do so.
Yes, we have achieved the Paris agreement. More countries have come together to sign this agreement today than for any other cause in the history of humankind—and that is a reason for hope—but unfortunately the evidence shows us that it will not be enough.
Our planet cannot be saved unless we leave fossil fuels in the ground where they belong. An upheaval and massive change is required, now. One that leads to a new collective consciousness. A new collective evolution of the human race, inspired and enabled by a sense of urgency from all of you.
We all know that reversing the course of climate change will not be easy, but
Renewable energy, clean fuels and putting a price on carbon pollution are beginning to turn the tide. This transition is not only the right thing for our world, but it also makes clear economic sense, and is possible within our lifetime.
But it is now upon you to do what great leaders have always done: to lead, inspire and empower as President
We can congratulate each other today, but it will mean nothing if you return to your countries and fail to push beyond the promises of this historic agreement. Now is the time for bold unprecedented action.
My friends, look at the delegates around you. It is time to ask each other—which side of history will you be on?
As a citizen of our planet who has witnessed so much on this journey I thank you for all you have done to lay the foundation of a solution to this crisis, but after 21 years of debates and conferences it is time to declare no more talk. No more excuses. No more 10-year studies. No more allowing the fossil fuel companies to manipulate and dictate the science and policies that effect our future. This is the only body that can do what is needed. You, sitting in this very hall.
The world is now watching. You will either be lauded by future generations, or vilified by them.
Lincoln’s words still resonate to all of us here today:
“We will be remembered in spite of ourselves. The fiery trial through which we pass will light us down, in honor or dishonor, to the last generation… We shall nobly save, or meanly lose, the last best hope of Earth.”
That is our charge now—you are the last best hope of Earth. We ask you to protect it. Or we—and all living things we cherish—are history.
Thank you.
YOU MIGHT ALSO LIKE
Scientists Share Why Keeping Warming Under 1.5 Degrees Celsius Is Crucial
Celebrating John Muir’s Incessant Study That Saved Yosemite National Park
Scientists Confirm: 93% of Great Barrier Reef Now Bleached
Bill Nye vs. Sarah Palin on Climate Change: Who Do You Believe?