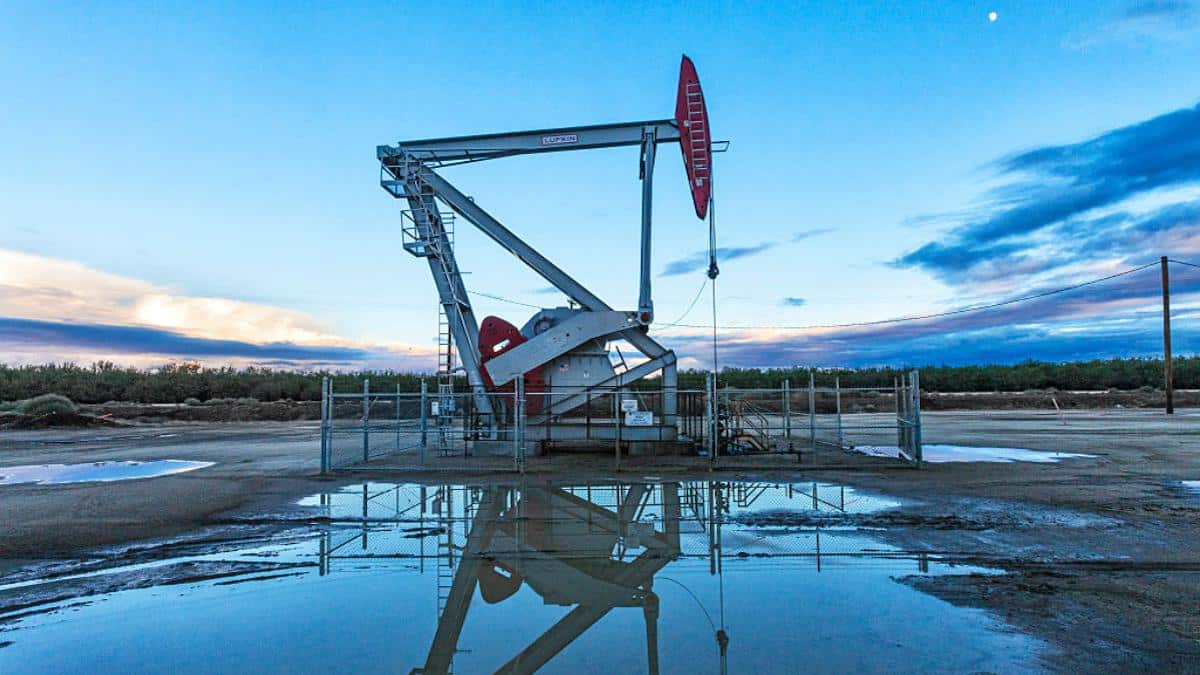
"Hydraulic fracturing activities have not led to widespread, systemic impacts to drinking water resources."
Or so says the U.S. Environmental Protection Agency's (EPA) press statement announcing the release of the agency's draft report on the risks to drinking water from fracking, and a legion of stories in the popular press that followed.
But is that what the scientific study itself found? (Spoiler alert: no)
A thorough review of the study suggests that the EPA misrepresented the findings of its own study in both the press release and the high-level summary. EPA's statement that it did not find evidence of widespread, systematic impacts fails to accurately reflect the uncertainty in the underlying data.
The fact is that EPA cannot say with any certainty how widespread or systematic impacts to drinking water from fracking are, due to a lack of available data.
Problem Number One: EPA's Press Statement
In an attempt to summarize this high-level finding from the study's Executive Summary, "We did not find evidence that these mechanisms have led to widespread, systemic impacts on drinking water resources in the United States," EPA's press statement changed the meaning.
As I explained in my blog on the report, not finding evidence of impacts is not the same thing as not finding impacts. EPA's press statement fails to accurately communicate this finding.
Problem Number Two: the Executive Summary
The bigger problem is, however, that finding itself. It does not faithfully summarize the results of the study.
EPA's ability to find evidence of impacts—let alone evaluate the frequency of those impacts—was seriously thwarted by a lack of available data. And when you read all 998 pages of EPA's study, not just the press release or Executive Summary, you find this confirmed over and over again. Here's a sample of the many places in the draft study where EPA made clear that they didn't have enough data to determine the presence of impacts, which in turn makes it impossible to determine the frequency or regularity of such impacts:
However, due to a lack of available data, little is known about the prevalence and severity of actual drinking water impacts. (p. 5-42)
The data contain few post-spill analyses, so ground water contamination may have occurred but have not been identified. (p. 5-46)
There was no reported sampling of soil or ground water to determine whether or not chemicals migrated into the soil. (5-69)
The lack of information regarding the composition of chemical additives and fracturing fluids, containment and mitigation measures in use, and the fate and transport of spilled fluids greatly limits our ability to assess potential impacts to drinking water resources. (p. 5-73)
There is a lack of baseline surface water and ground water quality data. This lack of data limits our ability to assess the relative change to water quality from a spill or attribute the presence of a contaminant to a specific source. (p.5-74)
There are documented chemical spills at fracturing sites, but a lack of available data limits our ability to determine impacts. (p. 5-74)
There are other cases in which production wells associated with hydraulic fracturing are alleged to have caused drinking water contamination. Data limitations in most of those cases (including the unavailability of information in litigation settlements resulting in sealed documents) make it impossible to definitively assess whether or not hydraulic fracturing was a cause of the contamination in these cases. (p. 6-53)
Subsurface monitoring data (i.e., data that characterize the presence, migration, or transformation of fluids in the subsurface related to hydraulic fracturing operations) are scarce relative to the tens of thousands of oil and gas wells that are estimated to be hydraulically fractured across the country each year (see Chapter 2). (p. 6-56)
These limitations on hydraulic fracturing-specific information make it difficult to provide definitive estimates of the rate at which wells used in hydraulic fracturing operations experience the types of integrity problems that can contribute to fluid movement. (p. 6-56)
Although it is collected in some cases, there is also no systematic collection, reporting, or publishing of empirical baseline (pre-drilling and/or pre-fracturing) and post-fracturing monitoring data that could indicate the presence or absence of hydraulic fracturing-related fluids in shallow zones and whether or not migration of those fluids has occurred. (p. 6-56)
Given the surge in the number of modern high-pressure hydraulic fracturing operations dating from the early 2000s, evidence of any fracturing-related fluid migration affecting a drinking water resource (as well as the information necessary to connect specific well operation practices to a drinking water impact) could take years to discover. (p. 6-56)
Because some components of hydraulic fracturing fluid are proprietary chemicals, and subsurface reaction products may be unknown, prior knowledge of the identity of analytes may not be available. Consequently, studies may be limited in their ability to determine the presence of either unknown or proprietary constituents contained in flowback or produced water simply because of the lack of knowledge of the identities of the constituents. (p. 7-14)
Of the volume of spilled flowback and produced water, 16 percent was recovered for on-site use or disposal, 76 percent was reported as unrecovered, and 8 percent was unknown. The potential impact of the unknown and unrecovered volume on drinking water resources is unknown. (p. 7-33)
A key parameter that is unknown is the number of crashes which impact drinking water resources, so definitive estimates of impacts to drinking water resources cannot be made. (p. 7-39)
Despite various studies, the total number of spills occurring in the United States, their release volumes and associated concentrations, can only be roughly estimated because of underlying data limitations. (p. 7-45)
Extensive characterization of produced water is typically not part of spill response, and therefore the chemicals, and their concentrations, potentially impacting drinking water resources are not usually known. (p. 7-46)
These unauthorized discharges represent both documented and potential impacts on drinking water resources. However, data do not exist to evaluate whether such episodes are uncommon or whether they happen on a more frequent basis and remain largely undetected. (p. 8-20)
In addition, unauthorized discharge of wastewater is a potential mechanism for impacts on drinking water resources. Descriptions of several incidents and resulting legal actions have been publicly reported. However, such events are not generally described in the scientific literature, and the prevalence of this type of activity is unclear. (p.8-58)
Unauthorized discharges of hydraulic fracturing wastewater have been documented; such discharges could potentially impact drinking water resources, but estimates of the frequency of occurrence cannot be developed with the available data. (p.8-68)
Monitoring of surface waters, even screening with a simple TDS proxy such as conductivity, would be needed to help assess how often hydraulic fracturing activities (including spills or discharges of wastewater) affect receiving waters; such data are lacking except for some studies in the Marcellus Shale region. (p. 8-73)
There are several notable uncertainties in the chemical and toxicological data that limit a comprehensive assessment of the potential health impacts of hydraulic fracturing on drinking water resources. (p. 9-37)
This assessment used available data and literature to examine the potential impacts of hydraulic fracturing for oil and gas on drinking water resources nationally. As part of this effort, we identified data limitations and uncertainties associated with current information on hydraulic fracturing and its potential to affect drinking water resources. In particular, data limitations preclude a determination of the frequency of impacts with any certainty. There is a high degree of uncertainty about whether the relatively few instances of impacts noted in this report are the result of a rarity of effects or a lack of data. (p. 10-17)
YOU MIGHT ALSO LIKE
Rolling Stone: ‘What’s Killing the Babies of Vernal, Utah?’
Earthquakes Tied to Fracking Boom, Two New Studies Confirm
Cancer-Causing Chemicals Found in Drinking Water Near Texas Fracking Sites
By Lynne Peeples
Editor's note: This story is part of a nine-month investigation of drinking water contamination across the U.S. The series is supported by funding from the Park Foundation and Water Foundation. Read the launch story, "Thirsting for Solutions," here.
In late September 2020, officials in Wrangell, Alaska, warned residents who were elderly, pregnant or had health problems to avoid drinking the city's tap water — unless they could filter it on their own.
Unintended Consequences
<p>Chemists first discovered disinfection by-products in treated drinking water in the 1970s. The trihalomethanes they found, they determined, had resulted from the reaction of chlorine with natural organic matter. Since then, scientists have identified more than 700 additional disinfection by-products. "And those only represent a portion. We still don't know half of them," says Richardson, whose lab has identified hundreds of disinfection by-products. </p>What’s Regulated and What’s Not?
<p>The U.S. Environmental Protection Agency (EPA) currently regulates 11 disinfection by-products — including a handful of trihalomethanes (THM) and haloacetic acids (HAA). While these represent only a small fraction of all disinfection by-products, EPA aims to use their presence to indicate the presence of other disinfection by-products. "The general idea is if you control THMs and HAAs, you implicitly or by default control everything else as well," says Korshin.</p><p>EPA also requires drinking water facilities to use techniques to reduce the concentration of organic materials before applying disinfectants, and regulates the quantity of disinfectants that systems use. These rules ultimately can help control levels of disinfection by-products in drinking water.</p>Click the image for an interactive version of this chart on the Environmental Working Group website.
<p>Still, some scientists and advocates argue that current regulations do not go far enough to protect the public. Many question whether the government is regulating the right disinfection by-products, and if water systems are doing enough to reduce disinfection by-products. EPA is now seeking public input as it considers potential revisions to regulations, including the possibility of regulating additional by-products. The agency held a <a href="https://www.epa.gov/dwsixyearreview/potential-revisions-microbial-and-disinfection-byproducts-rules" target="_blank">two-day public meeting</a> in October 2020 and plans to hold additional public meetings throughout 2021.</p><p>When EPA set regulations on disinfection by-products between the 1970s and early 2000s, the agency, as well as the scientific community, was primarily focused on by-products of reactions between organics and chlorine — historically the most common drinking water disinfectant. But the science has become increasingly clear that these chlorinated chemicals represent a fraction of the by-product problem.</p><p>For example, bromide or iodide can get caught up in the reaction, too. This is common where seawater penetrates a drinking water source. By itself, bromide is innocuous, says Korshin. "But it is extremely [reactive] with organics," he says. "As bromide levels increase with normal treatment, then concentrations of brominated disinfection by-products will increase quite rapidly."</p><p><a href="https://pubmed.ncbi.nlm.nih.gov/15487777/" target="_blank">Emerging</a> <a href="https://pubs.acs.org/doi/10.1021/acs.est.7b05440" target="_blank" rel="noopener noreferrer">data</a> indicate that brominated and iodinated by-products are potentially more harmful than the regulated by-products.</p><p>Almost half of the U.S. population lives within 50 miles of either the Atlantic or Pacific coasts, where saltwater intrusion can be a problem for drinking water supplies. "In the U.S., the rule of thumb is the closer to the sea, the more bromide you have," says Korshin, noting there are also places where bromide naturally leaches out from the soil. Still, some coastal areas tend to be spared. For example, the city of Seattle's water comes from the mountains, never making contact with seawater and tending to pick up minimal organic matter.</p><p>Hazardous disinfection by-products can also be an issue with desalination for drinking water. "As <a href="https://ensia.com/features/can-saltwater-quench-our-growing-thirst/" target="_blank" rel="noopener noreferrer">desalination</a> practices become more economical, then the issue of controlling bromide becomes quite important," adds Korshin.</p>Other Hot Spots
<p>Coastal areas represent just one type of hot spot for disinfection by-products. Agricultural regions tend to send organic matter — such as fertilizer and animal waste — into waterways. Areas with warmer climates generally have higher levels of natural organic matter. And nearly any urban area can be prone to stormwater runoff or combined sewer overflows, which can contain rainwater as well as untreated human waste, industrial wastewater, hazardous materials and organic debris. These events are especially common along the East Coast, notes Sydney Evans, a science analyst with the nonprofit Environmental Working Group (EWG, a collaborator on <a href="https://ensia.com/ensia-collections/troubled-waters/" target="_blank">this reporting project</a>).</p><p>The only drinking water sources that might be altogether free of disinfection by-products, suggests Richardson, are private wells that are not treated with disinfectants. She used to drink water from her own well. "It was always cold, coming from great depth through clay and granite," she says. "It was fabulous."</p><p>Today, Richardson gets her water from a city system that uses chloramine.</p>Toxic Treadmill
<p>Most community water systems in the U.S. use chlorine for disinfection in their treatment plant. Because disinfectants are needed to prevent bacteria growth as the water travels to the homes at the ends of the distribution lines, sometimes a second round of disinfection is also added in the pipes.</p><p>Here, systems usually opt for either chlorine or chloramine. "Chloramination is more long-lasting and does not form as many disinfection by-products through the system," says Steve Via, director of federal relations at the American Water Works Association. "Some studies show that chloramination may be more protective against organisms that inhabit biofilms such as Legionella."</p>Alternative Approaches
<p>When he moved to the U.S. from Germany, Prasse says he immediately noticed the bad taste of the water. "You can taste the chlorine here. That's not the case in Germany," he says.</p><p>In his home country, water systems use chlorine — if at all — at lower concentrations and at the very end of treatment. In the Netherlands, <a href="https://dwes.copernicus.org/articles/2/1/2009/dwes-2-1-2009.pdf" target="_blank">chlorine isn't used at all</a> as the risks are considered to outweigh the benefits, says Prasse. He notes the challenge in making a convincing connection between exposure to low concentrations of disinfection by-products and health effects, such as cancer, that can occur decades later. In contrast, exposure to a pathogen can make someone sick very quickly.</p><p>But many countries in Europe have not waited for proof and have taken a precautionary approach to reduce potential risk. The emphasis there is on alternative approaches for primary disinfection such as ozone or <a href="https://www.pbs.org/wgbh/nova/article/eco-friendly-way-disinfect-water-using-light/" target="_blank" rel="noopener noreferrer">ultraviolet light</a>. Reverse osmosis is among the "high-end" options, used to remove organic and inorganics from the water. While expensive, says Prasse, the method of forcing water through a semipermeable membrane is growing in popularity for systems that want to reuse wastewater for drinking water purposes.</p><p>Remucal notes that some treatment technologies may be good at removing a particular type of contaminant while being ineffective at removing another. "We need to think about the whole soup when we think about treatment," she says. What's more, Remucal explains, the mixture of contaminants may impact the body differently than any one chemical on its own. </p><p>Richardson's preferred treatment method is filtering the water with granulated activated carbon, followed by a low dose of chlorine.</p><p>Granulated activated carbon is essentially the same stuff that's in a household filter. (EWG recommends that consumers use a <a href="https://www.ewg.org/tapwater/reviewed-disinfection-byproducts.php#:~:text=EWG%20recommends%20using%20a%20home,as%20trihalomethanes%20and%20haloacetic%20acids." target="_blank" rel="noopener noreferrer">countertop carbon filter</a> to reduce levels of disinfection by-products.) While such a filter "would remove disinfection by-products after they're formed, in the plant they remove precursors before they form by-products," explains Richardson. She coauthored a <a href="https://pubs.acs.org/doi/10.1021/acs.est.9b00023" target="_blank" rel="noopener noreferrer">2019 paper</a> that concluded the treatment method is effective in reducing a wide range of regulated and unregulated disinfection by-products.</p><br>Greater Cincinnati Water Works installed a granulated activated carbon system in 1992, and is still one of relatively few full-scale plants that uses the technology. Courtesy of Greater Cincinnati Water Works.
<p>Despite the technology and its benefits being known for decades, relatively few full-scale plants use granulated active carbon. They often cite its high cost, Richardson says. "They say that, but the city of Cincinnati [Ohio] has not gone bankrupt using it," she says. "So, I'm not buying that argument anymore."</p><p>Greater Cincinnati Water Works installed a granulated activated carbon system in 1992. On a video call in December, Jeff Swertfeger, the superintendent of Greater Cincinnati Water Works, poured grains of what looks like black sand out of a glass tube and into his hand. It was actually crushed coal that has been baked in a furnace. Under a microscope, each grain looks like a sponge, said Swertfeger. When water passes over the carbon grains, he explained, open tunnels and pores provide extensive surface area to absorb contaminants.</p><p>While the granulated activated carbon initially was installed to address chemical spills and other industrial contamination concerns in the Ohio River, Cincinnati's main drinking water source, Swertfeger notes that the substance has turned out to "remove a lot of other stuff, too," including <a href="https://ensia.com/features/drinking-water-contamination-pfas-health/" target="_blank" rel="noopener noreferrer">PFAS</a> and disinfection by-product precursors.</p><p>"We use about one-third the amount of chlorine as we did before. It smells and tastes a lot better," he says. "The use of granulated activated carbon has resulted in lower disinfection by-products across the board."</p><p>Richardson is optimistic about being able to reduce risks from disinfection by-products in the future. "If we're smart, we can still kill those pathogens and lower our chemical disinfection by-product exposure at the same time," she says.</p><p><em>Reposted with permission from </em><em><a href="https://ensia.com/features/drinking-water-disinfection-byproducts-pathogens/" target="_blank">Ensia</a>. </em><a href="https://www.ecowatch.com/r/entryeditor/2649953730#/" target="_self"></a></p>EcoWatch Daily Newsletter
At a time of impending global food scarcity, cell-based meats and seafood have been heralded as the future of food.
- Most Meat Will Be Plant-Based or Lab-Grown in 20 Years, Analysts ... ›
- Lab-Grown Meat Debate Overlooks Cows' Range of Use Worldwide ... ›
- Will Plant-Based Meat Become the New Fast Food? - EcoWatch ›
Trending
One city in New Zealand knows what its priorities are.
Dunedin, the second largest city on New Zealand's South Island, has closed a popular road to protect a mother sea lion and her pup, The Guardian reported.
piyaset / iStock / Getty Images Plus
In an alarming new study, scientists found that climate change is already harming children's diets.
- No Country Is Protecting Children's Health, Major Study Finds ... ›
- 'Every Child Born Today Will Be Profoundly Affected by Climate ... ›
By Jeff Masters, Ph.D.
Earth had its second-warmest year on record in 2020, just 0.02 degrees Celsius (0.04°F) behind the record set in 2016, and 0.98 degrees Celsius (1.76°F) above the 20th-century average, NOAA reported January 14.
Figure 1. Departure of temperature from average for 2020, the second-warmest year the globe has seen since record-keeping began in 1880, according to NOAA. Record-high annual temperatures over land and ocean surfaces were measured across parts of Europe, Asia, southern North America, South America, and across parts of the Atlantic, Indian, and Pacific oceans. No land or ocean areas were record cold for the year. NOAA National Centers for Environmental Information
Figure 2. Total ocean heat content (OHC) in the top 2000 meters from 1958-2020. Cheng et al., Upper Ocean Temperatures Hit Record High in 2020, Advances in Atmospheric Sciences
Figure 3. Departure of sea surface temperature from average in the benchmark Niño 3.4 region of the eastern tropical Pacific (5°N-5°S, 170°W-120°W). Sea surface temperature were approximately one degree Celsius below average over the past month, characteristic of moderate La Niña conditions. Tropical Tidbits
- NASA and NOAA: Last Decade Was the Hottest on Record - EcoWatch ›
- Earth Just Had Its Hottest September Ever Recorded, NOAA Says ... ›