
 568k
568k  233k
233k  41k
41k  Subscribe

From the latest crisis over plans for Hinkley Point in the UK, to today’s fifth anniversary of the Fukushima disaster, nuclear power plants are currently much in the news.
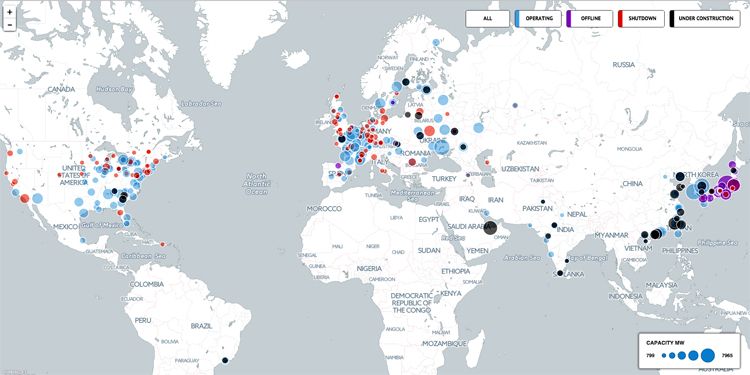
To help provide a global overview of the nuclear power sector both today and throughout its history, Carbon Brief has produced this interactive map.
It shows the location, operating status and generating capacity of all 667 reactors that have been built or are under construction, around the world, ever since Russia’s tiny Obninsk plant became the first to supply power to the grid in 1954.
Changing Fortunes
For some, the technology has fallen out of favor. Lithuania and Italy have shut down all of their reactors. Germany’s are being phased out. All except three of Japan’s remain offline following the tsunami of March 11, 2011 and the nuclear accident that followed.
For others, nuclear offers low-carbon energy and reduced reliance on dirty, imported fossil fuels. There are now 66 reactors under construction in 16 countries, including 24 in China.
Today, there are 400 reactors operating across 31 nations. Most were built in the two decades after 1970, giving the world’s fleet an average age of 29. This average varies regionally (see below).
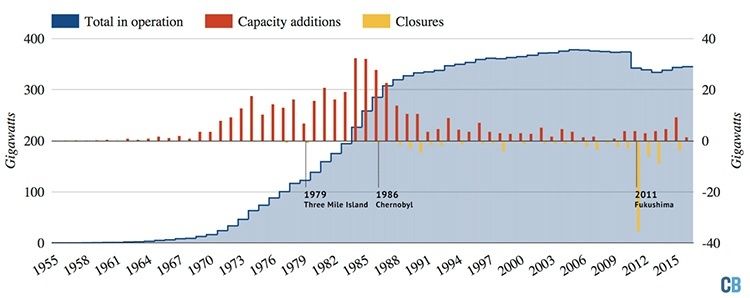
The total global generating capacity for nuclear power is 345 gigawatts (GW). This is down from a peak of 378GW in 2005, largely as a result of reactors being taken offline post-Fukushima.
Whereas “shutdown” reactors will remain closed, those that are “offline” could be restarted. (Where reactors in different categories are close together on the map above, their bubbles can overlap and the colours can become mixed. You can show each category in isolation by clicking on the tabs in the top right-hand corner).
Global Nuclear Power Generating Capacity
Apart from Fukushima, the nuclear industry has witnessed two other major disasters, both of which have had lasting international consequences.
Construction Delays
The first, in 1979, was at Three Mile Island in the U.S. In the decade before the accident, construction started on an average of 24 new reactors each year around the world. In the decade after, that fell to just 10.
In the wake of Three Mile Island, reactor designs were tweaked and safety specifications added. With changes applied retrospectively to reactors already under construction, there were inevitable delays and average build times increased, particularly in the U.S. itself.
Annual Capacity Additions and Construction Times

More stringent safety standards and construction delays also added to costs and enthusiasm for new nuclear waned. This has been described as a case of “negative learning by doing,” with nuclear costs increasing as capacity has grown.
According to the Nuclear Energy Agency, new nuclear power stations in the UK, such as the planned Hinkley Point C plant, would be the world’s most costly.
It’s worth noting, however, that some countries have managed to keep a lid on build times, as the chart above shows. They have also limited cost increases, with South Korea reported to have reduced costs as its experience has grown. Some analysts question cost data for South Korea, arguing it is in any case an exception to the trend of rising costs.
Falling Shares
The second major disaster to hit the world’s nuclear industry was Chernobyl, which took place 30 years ago, in April 1986. The last of Chernobyl’s four reactors continued to operate for another 14 years, until 2000.
In the 25 years after Chernobyl, nuclear construction declined while global demand for electricity more than doubled. As a result, nuclear’s share of total electricity supplies peaked just shy of 18 percent in 1996 before falling to 11 percent in 2014.
Nuclear Electricity Generation

According to the International Energy Agency, the rate at which new reactors are being added needs to quadruple by 2020 if the world is to meet its climate targets.
Today, the majority of the world’s reactors are concentrated in three broad regions: the eastern U.S.; Europe and the westernmost former Soviet states; and the far east (see map).