
 568k
568k  233k
233k  41k
41k  Subscribe
 Ocean Plastic: What You Need to Know


 Why you can trust us
Founded in 2005 as an Ohio-based environmental newspaper, EcoWatch is a digital platform dedicated to publishing quality, science-based content on environmental issues, causes, and solutions.
What Is Ocean Bound Plastic?
Ocean bound plastic is plastic waste that is headed toward our oceans. The term “ocean bound plastic” was popularized by Jenna Jambeck, Ph.D., a professor from the University of Georgia. In 2015, she and a team of researchers estimated the amount of plastic waste entering the ocean from land.
Addressing ocean bound plastic is a key element to ocean conservation. Around 80% of plastic in the ocean can be sourced back to ocean bound plastic. Plastics that end up near bodies of water such as rivers are at risk of ending up in the ocean. Other plastic can reach the sea through sewage systems or storms.
For example, in 2011, after the 2011 Tōhoku tsunami and earthquake hit Japan, around 5 million tons of debris ended up in the ocean. Some of the debris sank while some ended up on the U.S. west coast. Additionally, trash and plastic can come from ships or offshore platforms. However, decades ago, countries dumped their waste directly into the sea. In the U.S. this was outlawed in 1988 in the Ocean Dumping Ban Act of 1988.
Plastic waste is a huge threat to our Earth, and diverting ocean bound plastic is one way we can do better to help the environment.

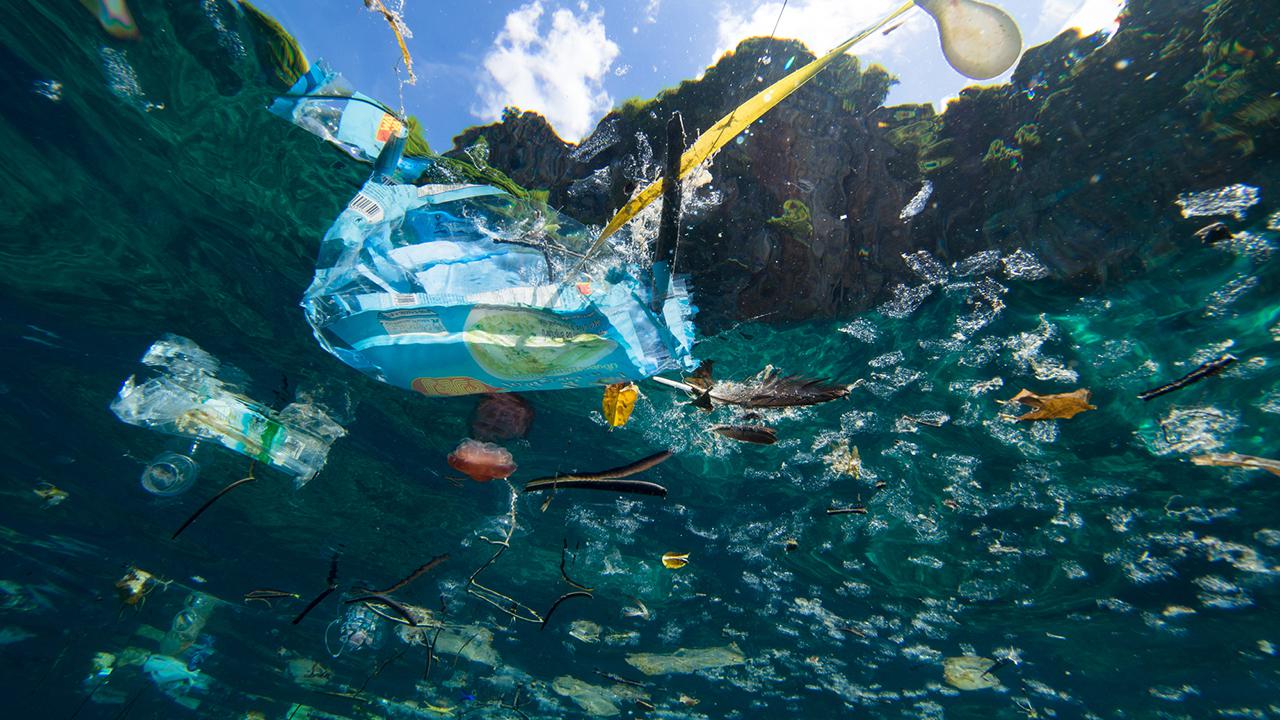
Fishes swim near a plastic fork and a bottle at the Samandag Cevlik Akcay diving site off the coasts of Samandag, near the Turkey – Syria border, in Hatay province of Turkey on December 6, 2018. Sebnem Coskun / Anadolu Agency / Getty Images
How Much Plastic Is in the Ocean?
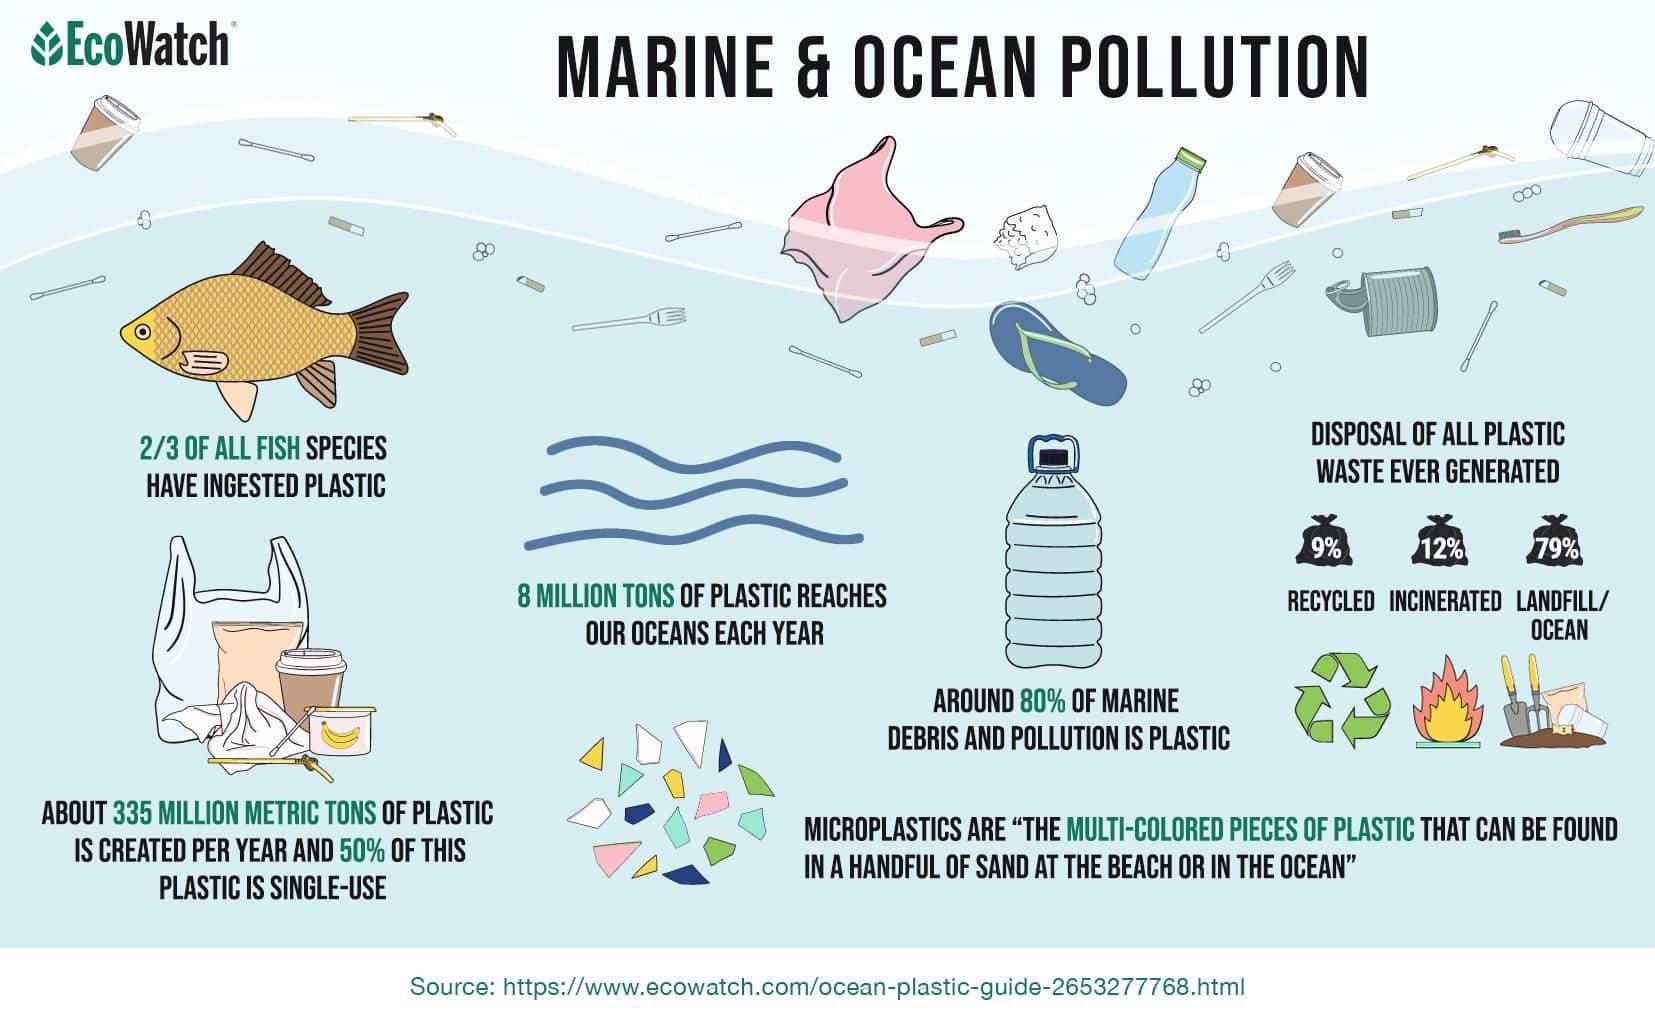
Each year, despite conservation efforts, 8 million tons of plastic reaches our oceans to meet the 150 million metric tons of plastic that already exists in marine environments. According to the Smithsonian, as of 2016, we produce around 335 million metric tons of plastic each year. Half of this plastic is single-use. Of the plastic we use globally, only around 9% of it gets properly recycled.
To create a mental picture of just how much plastic ends up in our oceans, imagine a garbage truck the size of New York City depositing its garbage into the ocean every minute of every day for a whole year. If this doesn’t frighten you enough, the amount of plastic that will be produced and consumed is supposed to double over the course of the next ten years. If nothing is done to address plastic consumption, and the aftermath, there could be over 250 million metric tons of plastic in our oceans in ten years.
Even if you don’t live on a coast, the plastic you throw away can still end up in the ocean. According to the World Wildlife Fund, plastic ends up in the ocean when it’s thrown away instead of recycled, when it’s littered on land, and when products we use are flushed down the drain or toilet. Additionally, cosmetic or cleaning products that contain parabens or microplastic beads can be washed into the ocean.
What Type of Plastic Is in the Ocean?

Plastic is not biodegradable, and it doesn’t decompose. Many plastics are made only to be used one time, where they are then thrown out; they’re known as single-use plastic.
During the 2017 International Coastal Cleanup, the top kinds of plastics that were collected included wrappers, bottles, grocery bags, take-out containers — and the infamous plastic straws. These types of plastics and others combine into a category scientists call “microplastics.” According to the National Ocean Service, microplastics are “the multi-colored pieces of plastic that can be found in a handful of sand on the beach or in the ocean.”
Around 12% of plastic is incinerated — leaving 80% to end up in landfills. A 2014 study found that there are around 244,000 metric tons of plastic floating in our oceans. Out of the 244,000 tons found in the ocean, around 79,000 tons can be found in the Great Pacific Garbage Patch, a mass of floating debris that’s twice the size of Texas.
Reducing our individual plastic footprint is important. However, most plastic pollution comes from large corporations. Corporations need to address their production processes, waste management, and how their operation can have an impact on the environment. Large corporations address their mass production of single-use plastics by shifting the responsibility of sustainable disposal onto the consumer.
According to Greenpeace.org, some of the brands that contribute to a large amount of plastic waste include Coca-Cola, PepsiCo, Nestlé, Unilever, and Colgate-Palmolive. The soft drink industry in particular creates tons of plastic waste. In 2016, Coca-Cola produced over 110 billion single-use plastic bottles.
The Problems With Ocean Plastic
Plastics floating and polluting the ocean only scratches the surface of issues it causes — it impacts all of marine life, people, and Earth’s climate.
Marine Life
Animals are impacted by the plastic we use and dispose of. Ocean plastic has already affected 267 species, and 86% of sea turtles. They can suffocate, drown, or get entangled in plastic, or even ingest it. Some species such as birds, fish, turtles, and whales can mistake plastic for prey, according to the International Union for Conservation of Nature. When marine life ingests plastic, they can die of starvation because their stomachs are filled with plastic debris. Marine life can be cut by plastic, and also receive internal injuries. Seabirds are known for feeding on the ocean’s surface, making them more likely to ingest floating plastic debris. Adult seabirds go to feed their young, and their chicks feed on this plastic: One study from 1997, conducted by Albatross Biology and Conservation, found that around 98% of chicks sampled had plastic in them, and the amount of plastic has been increasing over time.
Additionally, plastic debris can promote the spread of invasive organisms, further hurting marine ecosystems; floating plastics get carried out to sea through ocean currents.
Food and Health
Plastic debris doesn’t only harm the ocean’s wildlife — it’s affecting the human food chain, too. Microscopic plastic has been found in various foods and beverages, including water, beer and, salt. A 2008 Pacific Gyre voyage found that fish ingest plastic debris. Algalita researchers caught 672 fish, and 35% of the fish had eaten plastic pieces.
Climate Change
In a report released by Yale Climate Connections, Claire Arkin, communications coordinator for the Global Alliance for Incinerator Alternatives said, “Plastic pollution is not just an oceans issue. It’s a climate issue and it’s a human health issue.”
As of 2019, 4 to 8% of global oil consumption is linked to plastics, according to the World Economic Forum. If this persists, by 2050, plastics will account for 20% of oil consumption. Plastic, as a petroleum product, is inextricably linked to the fossil fuel industry: the extraction and transportation of fossil fuels releases carbon into the atmosphere, contributing further to the warming of our planet. Additionally, when plastic waste is incinerated, the process releases more carbon dioxide into the atmosphere.
The Human Impact
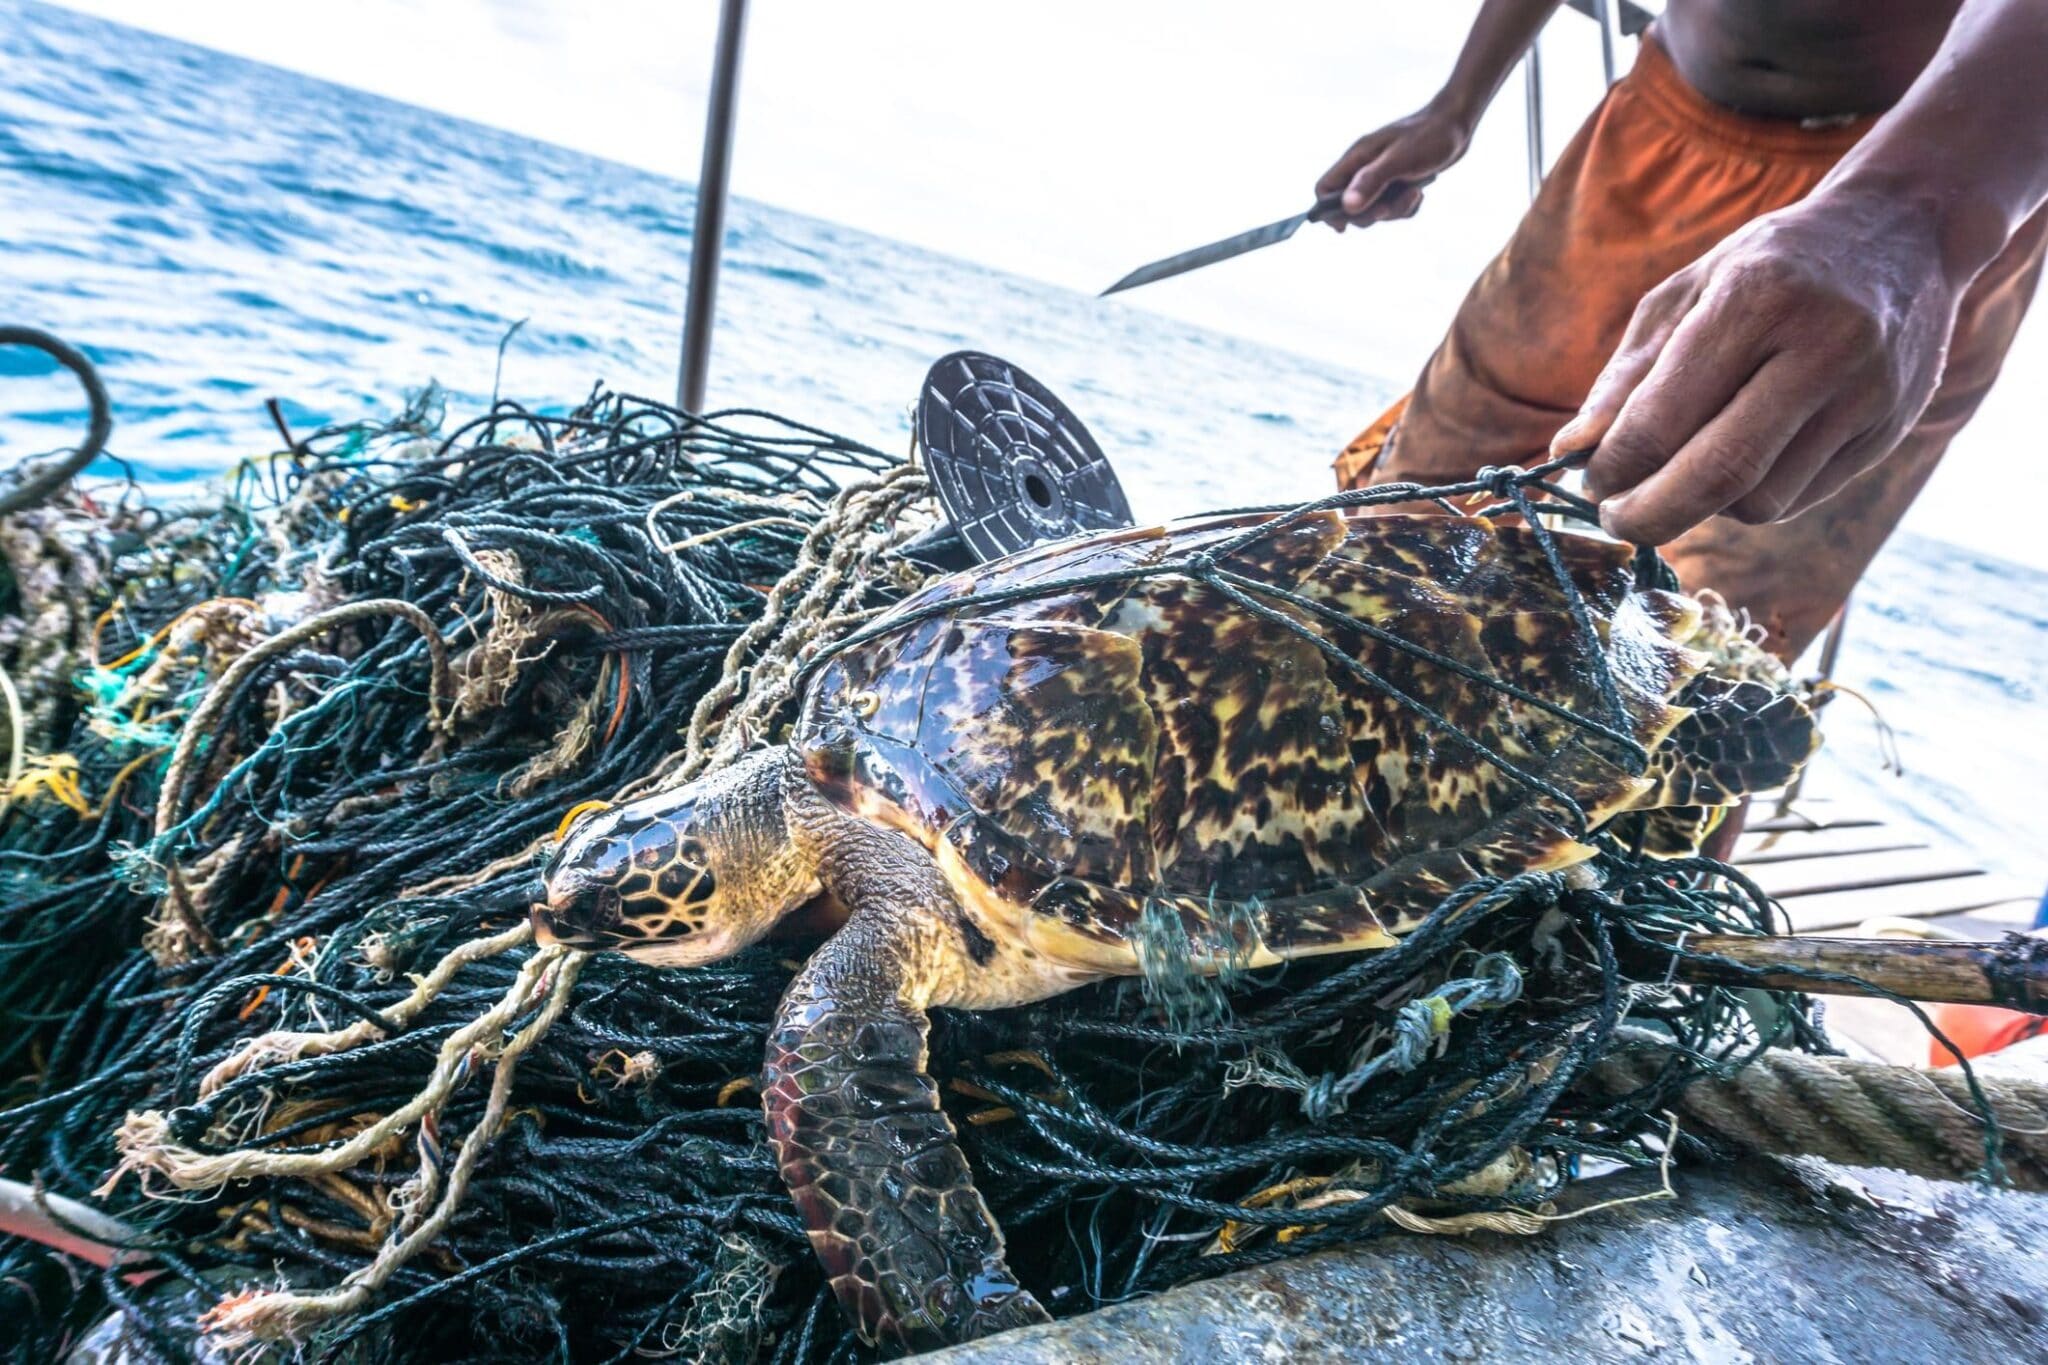
This rare Critically Endangered Hawksbill Sea Turtle (Eretmochelys imbricata) is entangled in discarded fishing net aka ‘Ghost nets.’ Placebo365 / iStock Unreleased / Getty Images
Plastic reaching the ocean is largely due to human consumption. Companies that use plastic packaging, and oil companies, are part of the problem when it comes to plastic accumulating in our oceans. Individual littering of plastic is another contributor, as well as the improper disposal or accidental losing of fishing gear in the ocean.
Improper Disposal of Fishing Gear
According to a report from Greenpeace.org, fishing gear is the largest contributor to ocean plastic pollution. Commercial fishing gear including nets, lines, pots, and traps gets discarded into the ocean. The lost gear weighs the same as 55,000 double-decker buses, according to The Guardian.
Abandoned fishing gear, also known as “ghost gear,” has the potential to trap marine life. In 2015, an 80-foot blue whale was caught in an abandoned fishing line. Not only does lost fishing gear make up a significant portion of all ocean plastic, around 10%, but it’s also the deadliest to marine life, including coral, sessile animals, and vegetation.
Abandoned gillnets have caused the vaquita porpoise to near extinction, in the upper Gulf of California and Mexico; around 10 vaquita porpoises remain.
In addition to environmental impacts, ghost gear can affect the economy negatively. Some studies estimate around 90% of the species caught in abandoned gear are commercially valued.
Solutions to Minimizing Ghost Gear
Although the statistics may seem grim, there are ways to prevent fishing gear from ending up in the sea and harming marine life.
One way to prevent ghost gear from entering our oceans is through recycling. Fishermen should return no longer useful traps and nets to a port, rather than discarding the materials into the ocean. There are ports in Massachusetts, Oregon, and Rhode Island that offer recycling programs; more recycling facilities at ports could help minimize littered fishing gear.
The use of biodegradable fishing nets is on the rise. According to a study published in Animal Conservation, there are encouraging tests that show the utility and effectiveness biodegradable nets may have. A net made of polybutylene succinate and polybutylene adipate-co-terephthalate showed promising results when compared to traditional nets used for fishing. The study showed that these biodegradable nets started to decompose after two years.
Clean-ups are another way to get abandoned fishing gear out of the ocean. There are organizations that specialize in retrieving discarded nets from the ocean. The Ghost Fishing Foundation has scuba divers retrieve floating fishing gear. Occasionally, the foundation will use cranes to pull out large pieces of netting.
Littering
Around 80% of marine debris and pollution is plastic, according to Pew Research. Marine litter mostly stems from unsustainable methods of production, as well as high consumption rates, and a lack of solid waste management infrastructure. Most of the plastic litter on Earth and in our oceans can be linked back to just a small number of multinational corporations.
According to an EPA report, “every bit of plastic ever made still exists.” The Plastic Disclosure Project estimated that 33% of all manufactured plastic is only used once. In 2018, only 8.7 percent of plastic was recycled. Although individuals should do their part to keep our planet and oceans clean, a small number of multinational corporations are to blame for the majority of littered plastic.
What Is Being Done to Help?

Greenpeace activists assembled two life-size reproductions of two whales that emerge from a sea invaded by disposable plastic waste, in the center of Rome, to denounce how our seas and the species living in them are in grave danger due to plastic pollution in 2018. Stefano Montesi / Getty Images
An elementary concept to positively impacting the environment is the buzz phrase, “reduce, reuse, recycle.” What this phrase fails to consider is that what will make the largest impact in helping our environment is to hold large corporations accountable. According to Greenpeace.org, recycling alone will never solve the plastic and pollution crisis our society is facing.
Organizations
Many organizations are addressing the ongoing and ever-growing issue of ocean pollution. For example, The Ocean Cleanup, a non-profit aimed at ridding the ocean of plastic, is developing advanced technologies that are contributing to the largest ocean cleanup in history. The non-profit’s goal is to clean up 90% of floating ocean plastic pollution.
Plastic Oceans International is another organization that produces films and digital content in order to promote “a global movement to rethink plastic.” They also engage and teach students about the effects of plastic pollution and how they can contribute to ocean conservation.
Plastic Bank aims to not only stop ocean plastic but improve the lives of people who live in the poorest countries around the globe. The organization builds recycling ecosystems and processes the materials, so they can then be reintroduced to the economy through the global manufacturing supply chain.
One organization, Plastic Soup Foundation, aims not only to remove plastic from our oceans but also prevent plastic from reaching the sea in the first place. When it was founded, the organization had a heavy focus on protecting marine life, but the organization has expanded its priorities and aims to educate people on the potentially harmful effects marine plastic has on human health.

Indian residents walk past as they look at a large-scale sculpture of a killer whale made of single-use plastic and 40,000 plastic bottle caps being displayed to raise awareness on ocean contamination at Elliot’s beach in Chennai on May 11, 2019. ARUN SANKAR / AFP / Getty Images
Legislation
Some legislation helps to protect the oceans, and minimize plastic production and consumption. In the U.S, eight states have banned the use of single-use plastic bags, and more are hoping to in the coming years, including Connecticut and Virginia. Washington, DC implemented a ban on plastic straws on Jan. 1, 2019.
The Marine Debris Research, Prevention, and Reduction Act established programs in tandem with the National Oceanic and Atmospheric Administration and the United States Coast Guard. The programs help to determine sources of marine debris and how to reduce and prevent it.
Policies such as The Shore Protection Act, established in the U.S. in 1988, help to prevent the illegal dumping of waste off the coast. In 1967, a supertanker named Torrey Canyon spilled nearly 120,000 tons of oil into the ocean; it was the world’s first major oil tank disaster. Because of this incident, the Act to Prevent Pollution from Ships, passed in the U.S., most recently has been amended to regulate air pollution. It also regulates and limits the amount of nitrogen oxide levels, as well as requiring ships to use fuel with low sulfur content.
While these laws help to reduce pollution in our oceans, none of the laws listed are a cure-all, and many of them haven’t been amended in decades. Some conservation organizations are fighting for more rigorous laws, regulations, and policies to keep our oceans plastic-free.
What Can You Do?
Although large corporations are responsible for a majority of plastic waste ending up in the oceans, there are still things to be done on an individual level to help keep our oceans clean.
Reduce, Reuse & Recycle
Something everyone can do to contribute to the fight against ocean plastic pollution is to resist and reduce the use of single-use plastics. From plastic bags and bottles to plastic utensils, reducing your use of these plastics is a relatively easy step in limiting your plastic footprint.
When grocery shopping, bring your own reusable grocery bags. These bags are widely available and will last you a long time. Instead of using thin plastic produce bags, opt for reusable produce bags as well. Implementing the use of these reusable products will make you a more sustainable grocery shopper. There are incentives for altering your plastic consumption as well. At Target, for each reusable grocery bag you use, you get a 5 cent discount.
In recent years, Starbucks has made the switch to strawless drinking lids for their cold beverages. However, if you enjoy drinking out of straws, or want to prevent teeth staining, try using metal or reusable straws. They’re widely available and easy to clean, and you can use them hundreds of times. Before the pandemic, Starbucks also started implementing reusable cups and tumblers. This way, when you make your coffee run, you don’t have to use any single-use plastic. When you bring your own cup, you get a 10-cent discount. The program should continue when health authorities deem it’s safe to do so.
Other major chains have similar programs where you can bring your own cup or tumbler, including Dunkin’, Panera Bread, Einstein Bros. Bagels, Caribou Coffee, Peet’s Coffee, and more.
Another ocean contaminant is microbeads and parabens. These are found in cosmetic products like face washes, toothpaste, and body washes. If you look at the ingredient list and see “polyethylene or “polypropylene,” the product contains harmful microbeads, and you should avoid it.
When you grab some food to go, many restaurants will put your food in styrofoam containers, and then throw it in a plastic bag, and then go even further by supplying a bunch of paper napkins and plastic utensils. You can buy reusable utensils that are meant for traveling so you can skip the plastic utensils.
A more creative way to limit the amount of plastic you use is to buy in bulk. Singe-serving foods multiply waste. When you’re grocery shopping, opt for a large tub of yogurt, instead of many small, single-serving yogurts. Buy trail mix that comes in one container, rather than many individually wrapped little ones. Buying products that you routinely use and consume in bulk can make a big difference.
When you forget your reusable bag or cup and have to use single-use plastic, you can help the environment and the oceans by recycling it properly. Be sure to be in the know about what types of plastics can be recycled in your community. If you’re unsure of what you can and cannot recycle in your town, check out Earth911’s recycling directory.
Engage in Cleanups

Employees from the organization 4Ocean clean Bali’s beaches daily from plastic Bali has long grappled with plastic pollution both on land and in its seas. Jonas Gratzer / LightRocket / Getty Images
Another tangible way to help is by physically removing plastic from the ocean and beaches by participating in a cleanup. If there are no cleanups in your community, organize your own. There are also larger cleanup events such as the International Coastal Cleanup that you can be a part of. Whether it’s with an organization or your friends and family, participating in a cleanup is a simple way to help collect plastic waste from marine communities.
Donate
There are a variety of organizations that aim to reduce the amount of plastic in our oceans, in creative, technologically advanced ways. Many of these organizations are non-profits and rely heavily on donations to continue to do important environmental work. Making a donation, even if it’s small, will help these organizations to continue to clean up and conserve our oceans.
Takeaway
Plastic debris floating in our oceans doesn’t just affect the marine wildlife and plant species — it affects all of us. If action isn’t taken now, there will be catastrophic consequences.
Plastic already kills over 100 million ocean animals each year; this number will only increase as time goes on.
Fish are being over-harvested already, but with many fish species dying off, and more fish consuming plastic, the fishing industry as we know it may not survive if incessant ocean pollution continues. This affects the entire food chain and will affect many fishermen’s livelihoods.
Ocean pollution is a huge threat to the overall biodiversity of our oceans. For example, coral reefs’ DNA can be altered from ocean pollution. Many fish and marine life rely on coral reefs for survival. If fish can no longer live in coral reefs, they won’t gather in the same areas, affecting the land wildlife on the shore who fish for food. If the land animals cannot feed on fish, they may venture into new hunting territories, putting them at risk of being attacked by unfamiliar predators, which can then lead to extinction.
The impact of ocean plastic extends beyond marine life. If marine animals are affected, land animals will be affected and humans will be affected. The pollution of the oceans sets off a domino effect on the greater environment.
Oceans make up 71% of our Earth. If the sea isn’t healthy and thriving, the majority of our planet isn’t. Ocean plastics are a major threat to the health and well-being of all living species on Earth.
Audrey Nakagawa is the content creator intern at EcoWatch. She is a senior at James Madison University studying Media, Art, and Design, with a concentration in journalism. She’s a reporter for The Breeze in the culture section and writes features on Harrisonburg artists, album reviews, and topics related to mental health and the environment. She was also a contributor for Virginia Reports where she reported on the impact that COVID-19 had on college students.
Subscribe to get exclusive updates in our daily newsletter!
By signing up, you agree to the Terms of Use and Privacy Policy & to receive electronic communications from EcoWatch Media Group, which may include marketing promotions, advertisements and sponsored content.