
 568k
568k  233k
233k  41k
41k  Subscribe
What Is Biodiversity?
Polar bears, honeybees, mango trees and coral reefs are all examples of the countless animal and insect species, plant life and ecosystems that comprise the planet’s vast biodiversity. Every living organism has a role to play in an intricate web of connectedness, no matter the size, and without them, there would be no life on Earth. Removing just one from the chain can send significant ripple effects throughout the system, even if those effects aren’t immediately felt. More crucially, every species lost increases the extinction risk to another connected species.
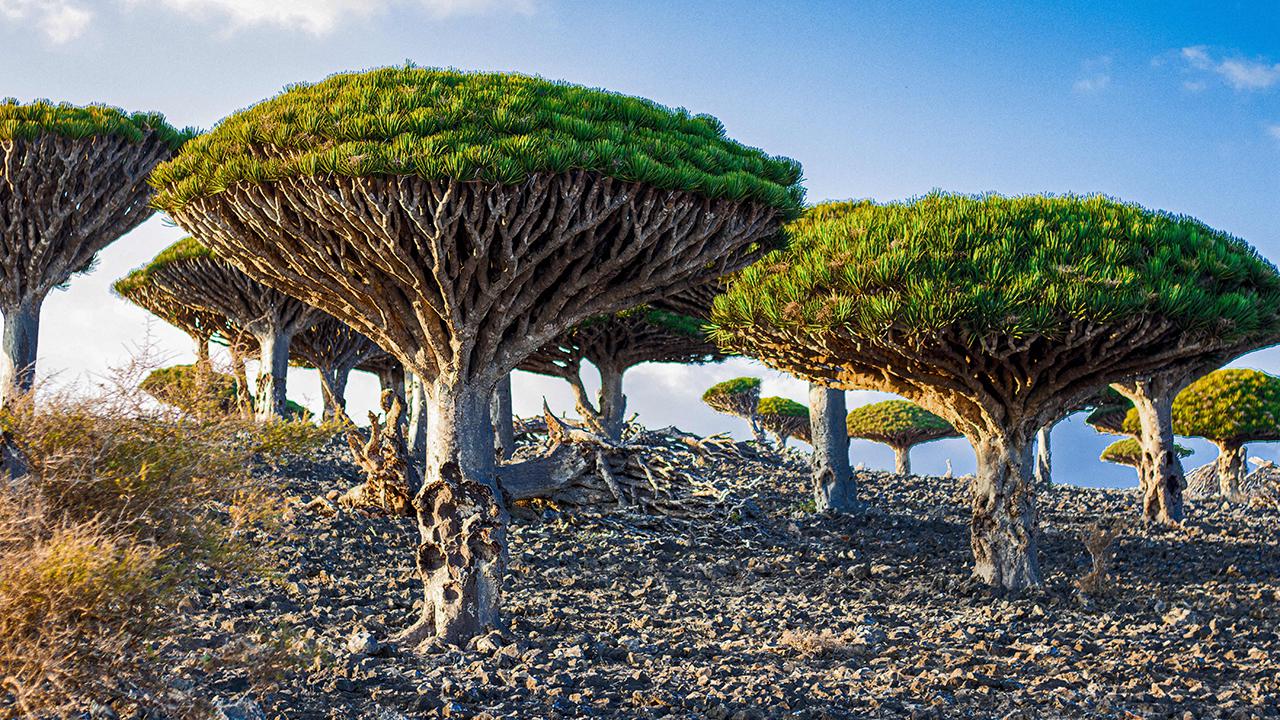
While biodiversity exists wherever there is life, there are some places on Earth that are considered biodiversity hotspots — specific areas that are teeming with native species that can’t be found anywhere else in the world, from koalas in Australia to giant pandas in China. There are currently 36 areas that qualify as hotspots, but consider this: While that number comprises only 2.4 percent of the planet, those regions contain almost 43 percent of endemic species. But these hotspots are increasingly threatened by human activity and climate change.
Not only that, but a United Nations Intergovernmental Science-Policy Platform on Biodiversity and Ecosystem Services Report warned that about a million species currently face extinction, and for some it’s just a matter of decades. As it stands, a 2018 World Wildlife Fund report shared that the world’s vertebrate populations declined an average 60 percent in each category (mammals, birds, fish, reptiles and amphibians) since 1970.
Why Is Biodiversity Important to Ecosystems?
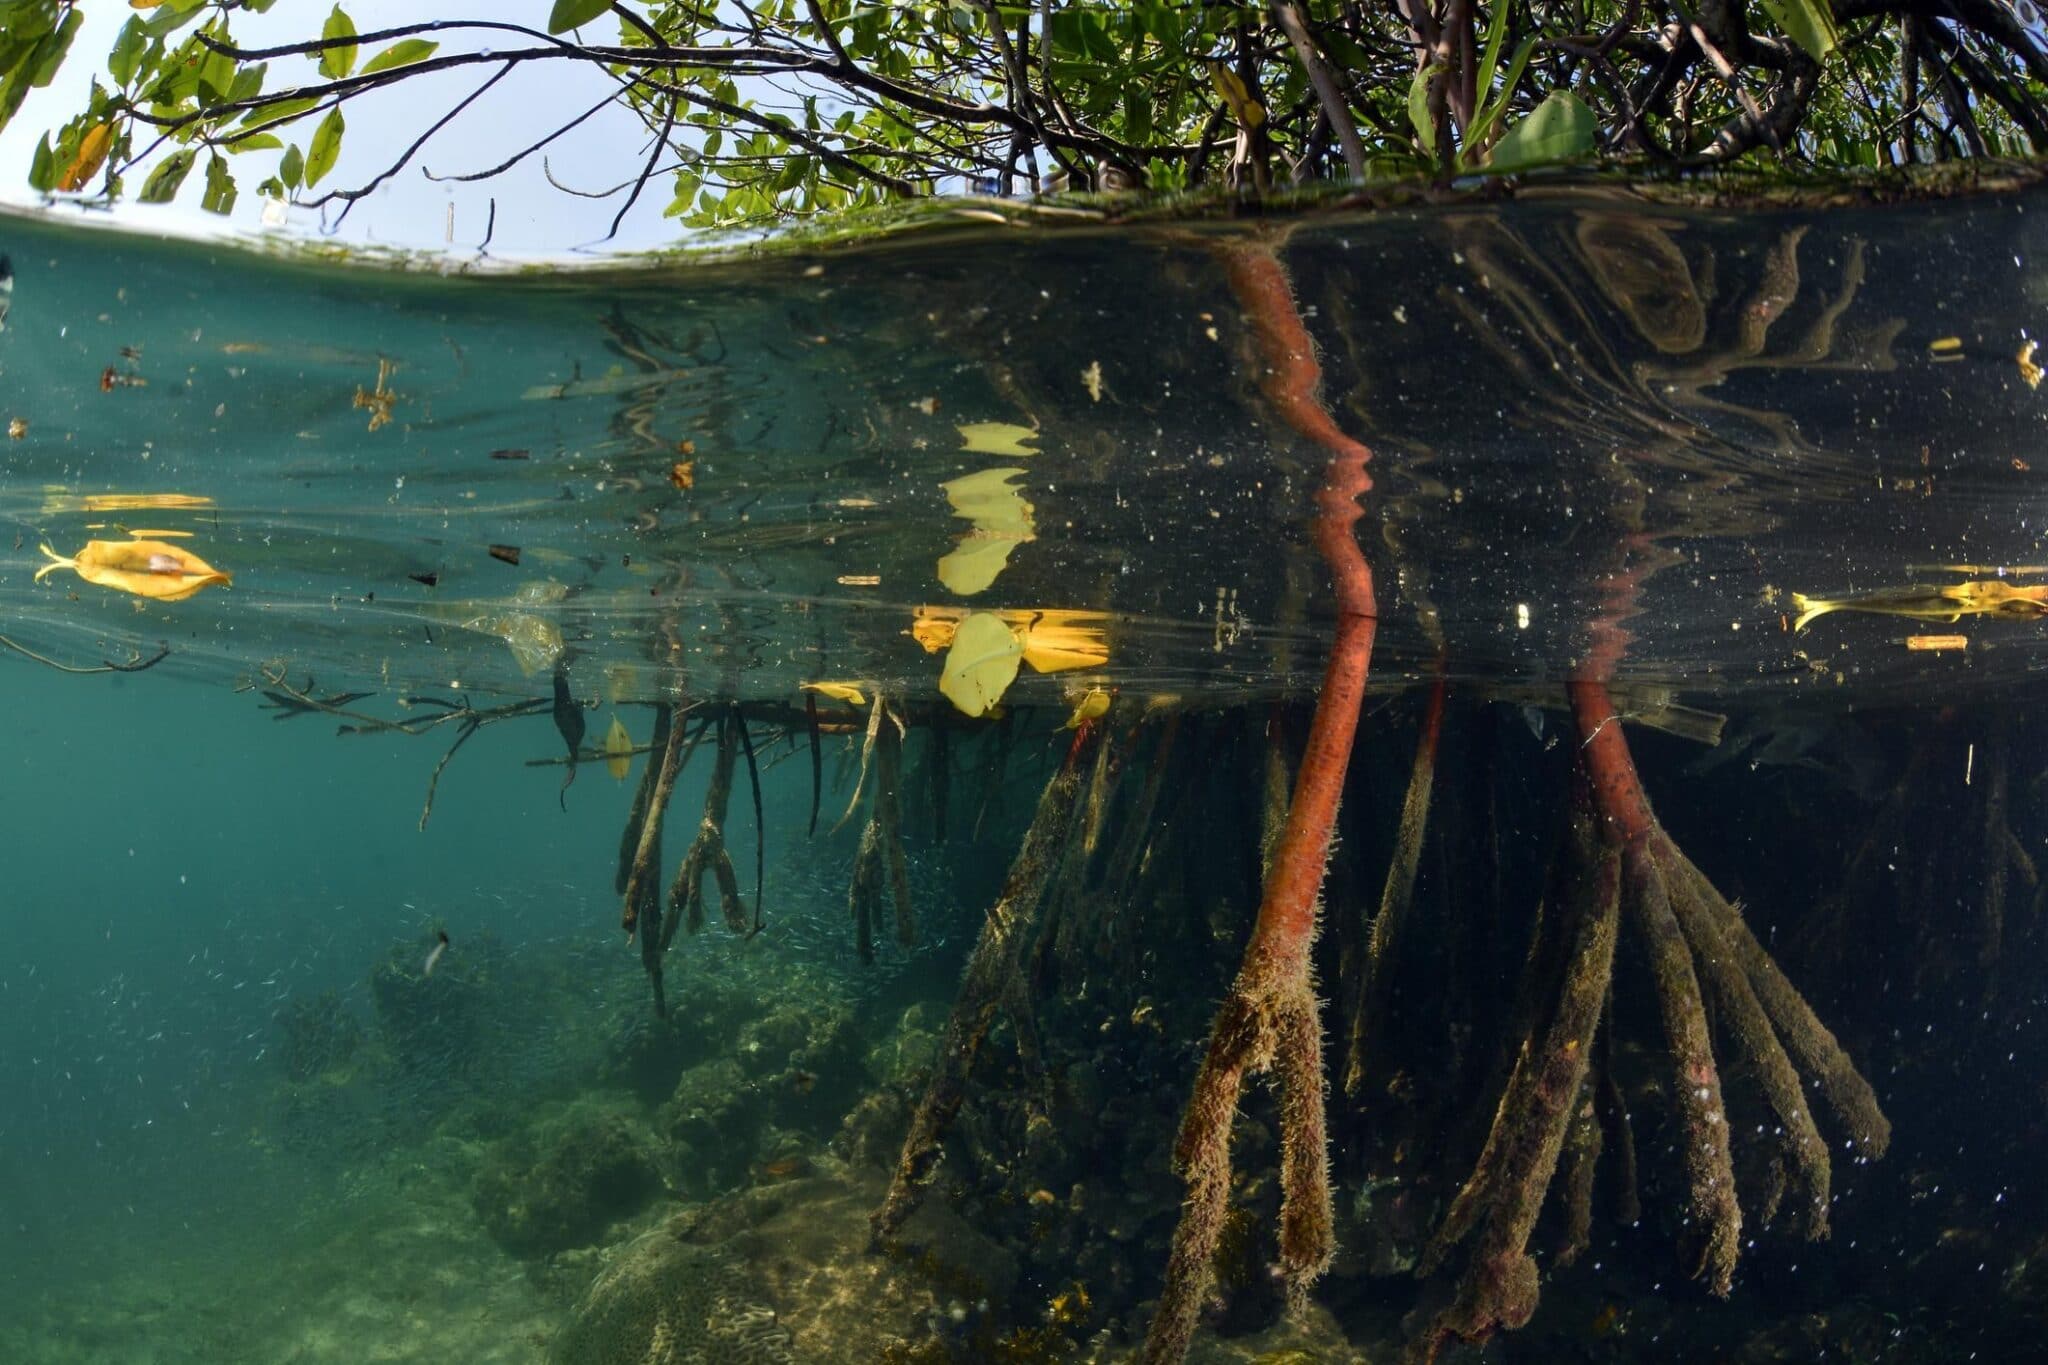
Mangrove roots in Mochima, Venezuela. Humberto Ramirez / Moment / Getty Images
Think of biodiversity as acting behind the scenes of day-to-day life. It’s nature’s way of providing clean air and water, food, resources (medicine, wood) and even climate protection. Yet consider that only 20 percent of Earth’s species — at most — have been identified by science. Swedish botanist Carl Linnaeus began the daunting task in the 1700s, and since that time scientists have estimated that about 8.7 million unknown species exist, although only about 1.2 million species have been identified. Of that number, who knows how many critical ecosystem players have already gone extinct, or are critically endangered, before their role is even clear?
How Do Insects and Animals Impact Us?
It’s impossible to discuss this without covering the sixth mass extinction. As the name indicates, there have already been five mass extinction events throughout history, with the last one wiping out the dinosaurs 67 million years ago following an asteroid strike. After each of the prior mass extinctions, which were mainly caused by environmental factors that eliminated as much as 95 percent of existing species, scientists estimated that it took millions more years before biodiversity regained pre-mass extinction numbers.
The difference today is that the current ongoing extinction threat could have been avoided since it’s a human-led catastrophe. A recent study from the Proceedings of the National Academy of Sciences revealed that more than 237,000 populations of 515 species have likely gone extinct since 1900, with many more not far behind; or, 100 times faster in the past 100 years compared to the more normal range of up to 10,000 years for some species. So what does that really mean?
Consequences
Without the proper number of species performing their daily tasks, the everyday aspects of life that we take for granted, including oxygen and a plentiful food supply, will worsen. For example, the International Union for Conservation of Nature (IUCN) has listed seven honeybee species as critically endangered. If all of the world’s bees were to disappear, there would be few insects left to pollinate certain plants, ultimately affecting global food supply chains and the economy. A recent study found that bees and other insect pollinators contributed 34 billion to the U.S economy in 2012 alone.
While the worst-case scenario has yet to happen regarding bees, the world is still dealing with the very likely connection between biodiversity loss and infectious diseases. Though still unproven, scientists are getting closer to linking habitat loss and the deadly COVID-19 pandemic. Less land increases the likelihood of diseases spreading from animal species, such as bats, to humans. Until habitat loss is properly addressed, experts warn that pandemics will only increase in severity and frequency.
Then there are the financial costs, which are twofold. A UN report found that governments around the world allocated between $78-91 billion a year on biodiversity goals, when in fact hundreds of billions of dollars a year are needed, the report estimated. Without spending more to tackle the issues, biodiversity loss will wind up costing the world up to $140 trillion a year.
Which Species Are Most At Risk?
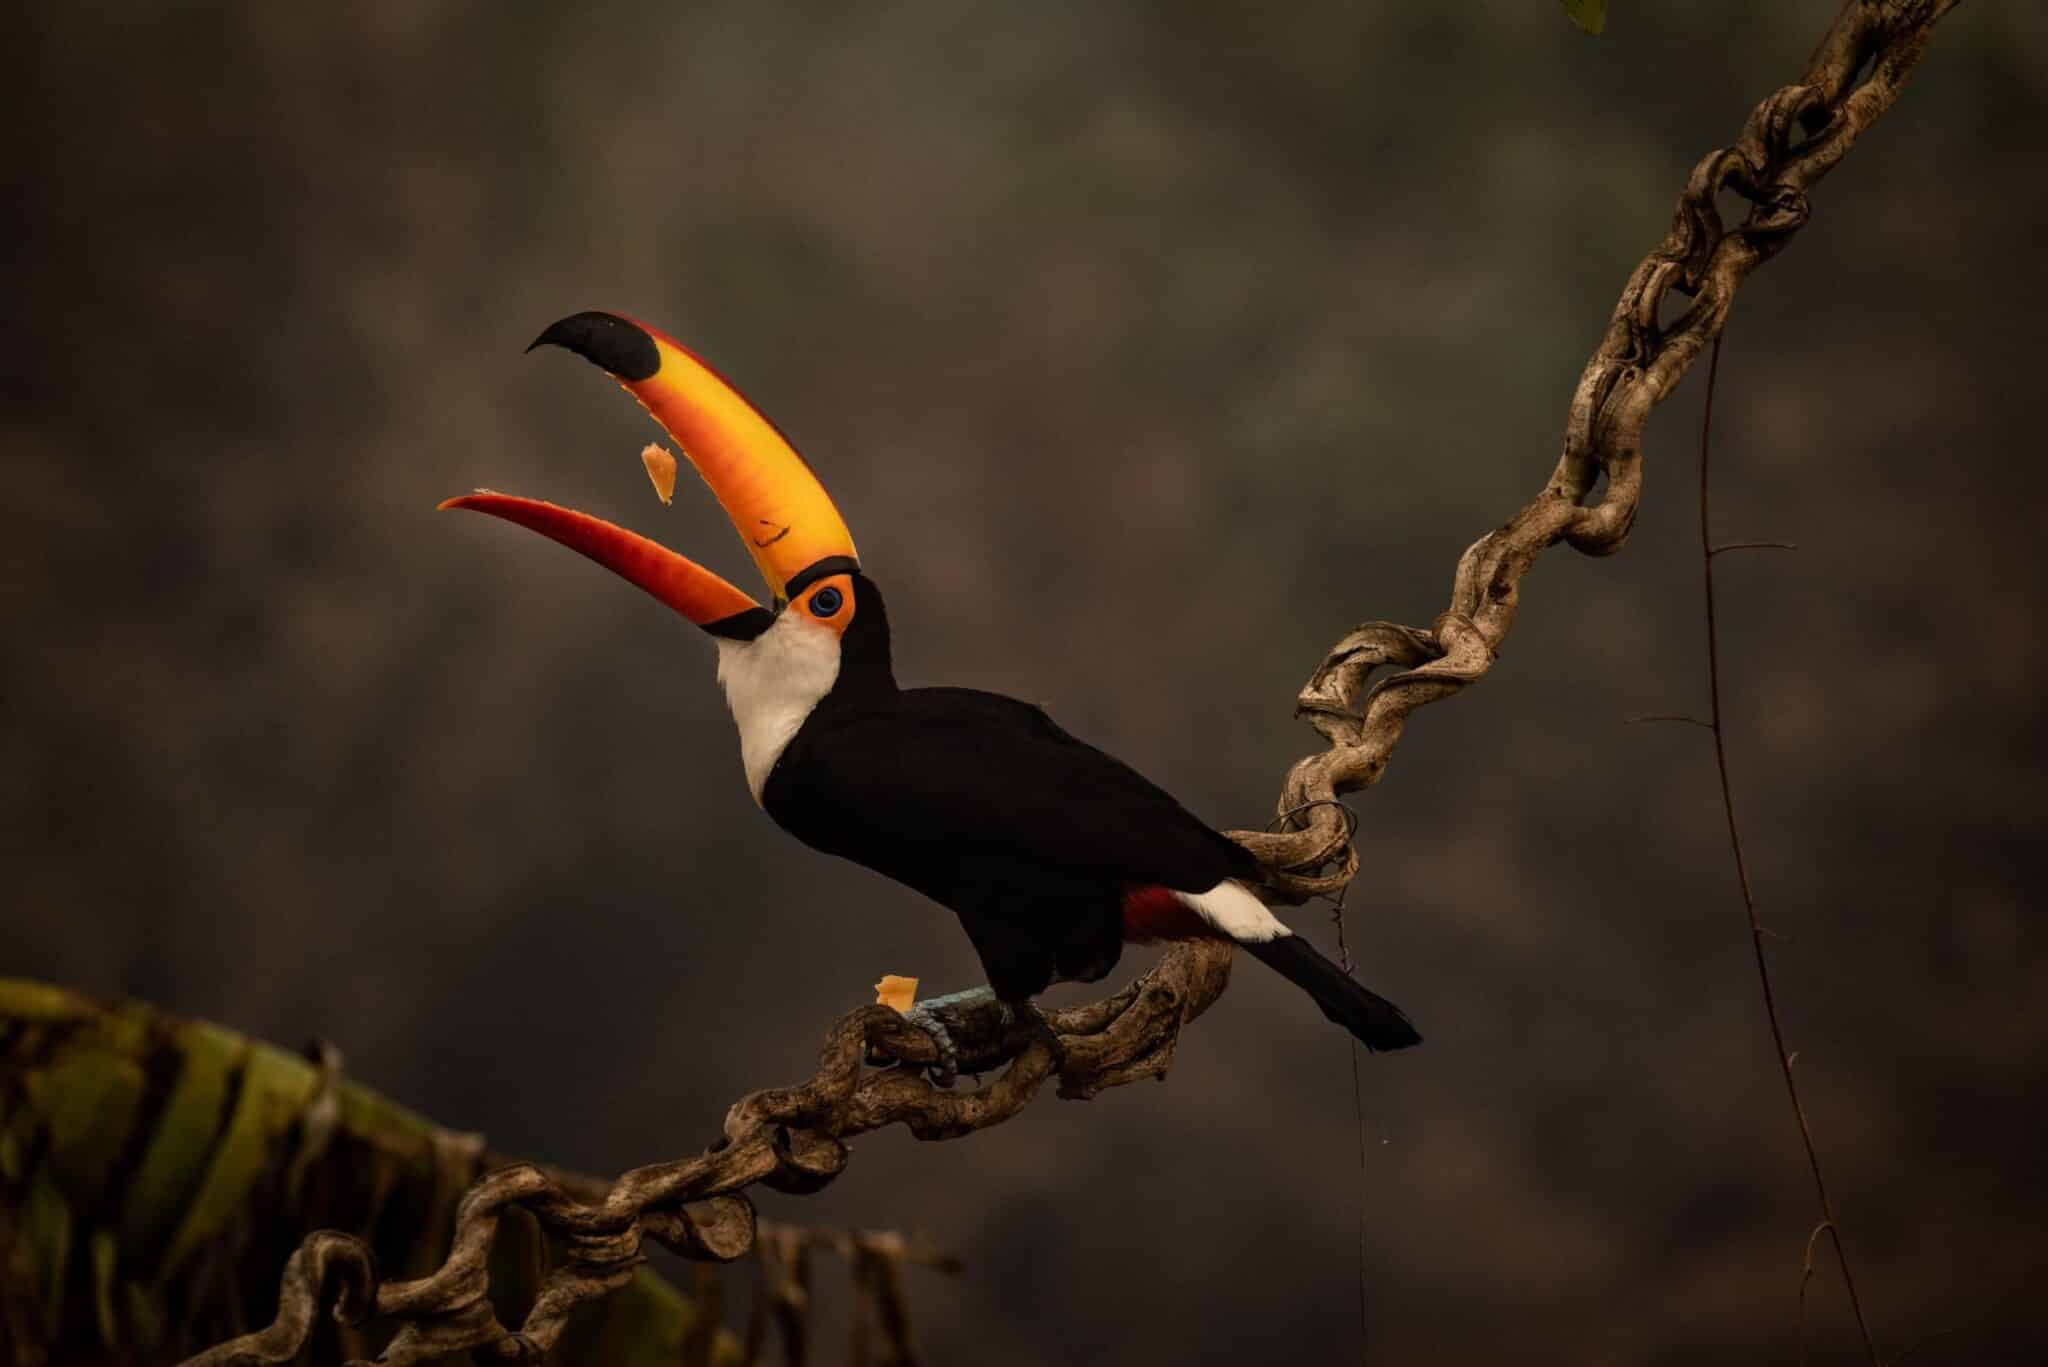
A Toucan feeds on fruit offered on Aug. 24 2020 at an inn at km 110 of the Transpantaneira highway whose fire consumed everything around along with the wildfires that has already burned more than 16.500 sq. km of the Brazilian Pantanal. Gustavo Basso / NurPhoto / Getty Images
The IUCN Red List identifies which species are most at risk for extinction, including their numbers, direct threats and conservation efforts. The Red List estimates that more than 37,000 known species currently face extinction, including, but not limited to, 41 percent of amphibians, 36 percent of sharks, 33 percent of coral reefs, 26 percent of mammals and 14 percent of birds. The IUCN has categorized species into Not Evaluated, Data Deficient, Least Concern, Near Threatened, Vulnerable, Endangered, Critically Endangered, Extinct in the Wild and Extinct. Among the most critically endangered are Amur leopards, vaquita porpoises, Sumatran rhinos and Cross River gorillas. In some cases, such as the vaquita porpoise, researchers believe less than a dozen exist in the wild.
Many other species, including those in the food chain such as Chilean sea bass and Atlantic bluefin tuna, are being pushed toward extinction thanks to popular consumer demand, which leads to overfishing.
Then there are the species that the world has permanently lost in the last 100 years, from the Tasmanian tiger, which was hunted to extinction (mainly for museum display purposes) to the Pinta giant tortoise, a Galápagos native that was hunted to extinction by the fishing industry. The last known survivor, Lonesome George, passed away in captivity in 2012. In more recent years, the media has been following the world’s last two remaining northern white rhinos. Both female, their kind is headed toward extinction, but scientists are attempting IVF using white rhino surrogates in the wild.
Yet the question remains, why are so many species going extinct or are threatened with extinction compared to previous centuries? As with most complex issues, there’s no one explanation. Rather, a combination of population growth/overconsumption, the wildlife trade, pesticides, pollution, hunting, deforestation, wildfires, invasive species, big ag and climate change are among the larger culprits.
Habitat Loss
This category poses the largest threat to global biodiversity as rainforests to plains are cleared to make way for agriculture, housing and everything else that comes with modern-day living. Rainforests around the world especially suffered in 2020, having lost 12 percent of tree cover due in part to wildfires. Many of these wildfires in turn are caused by deforestation, with Brazil leading the way under far-right President Jair Bolsonaro to raze this resource for more profitable industries involving cattle and soy. As a result, Brazil’s deforestation loss hit a 12-year high in 2020 according to the National Institute for Space Research (INPE). This biodiverse hotspot is now at risk of losing endangered species such as the Amazonian jaguar, hyacinth macaw, pink dolphins and spider monkeys. Other major habitat loss threats throughout the Amazon come from gold mining and logging. Unfortunately, this scale of destruction isn’t limited to the Amazon, with habitat loss taking a toll on species everywhere from Nepal and Borneo to China and Africa.
Big Ag
Ironically, the industry responsible for providing the world’s food supply is also a major contributor. Industrial agriculture is a main culprit behind habitat loss as increasing amounts of land are converted to feed growing populations. Compounding this is an overreliance on a small number of crops and animals to meet global food supply needs, placing some of these species at risk for extinction.
Population Growth
About 600 million people populated the planet in 1700 compared to 7.7 billion in 2019. Future projections put that number even higher, reaching 10.9 billion by 2021. This massive population boom has taxed Earth’s finite resources. While a Population Action International study has concluded that this boom is an indirect cause of biodiversity loss, it’s nonetheless a habitat loss driver as more land is needed every year for food and other resources, along with urban and industrial development.
Pollution
With increased land clearing and development comes increased pollution on a range of levels. This takes a toll on ecosystems in a myriad of ways: For example, chemical-laden water causes toxic algae blooms; rapidly changing climates make it difficult for many species to adapt; rising ocean temperatures bleach and kill coral reefs; oil spills kill fish, birds and other wildlife; and plastic pollution strangles or slowly kills wildlife that ingest it. Throw in noise pollution, light pollution, acid rain and pesticides, and it’s no wonder that many species are experiencing population declines due to decreased breeding and numbers.
Pesticides
Speaking of pesticides, these chemicals are most notably destroying bee populations. While they’re not the only reason, pesticides are a direct link. The Center for Food Safety found that some beekeepers have been reporting a complete loss of their colonies in recent years; at the same time, studies are showing a link between declining bee populations and pesticides: neonicotinoids in particular. Not only are these the most common insecticide, but neonicotinoids saturate an entire plant, not just the surface, proving especially toxic to bees. To put this in greater perspective, the United Nations Environment Programme has determined that 71 out of 100 crops are pollinated by bees, and these 100 crop varieties supply 90 percent of the global food supply.
Invasive Species
This category is another contributor to bee loss, but invasive species are increasingly threatening all manner of plant and animal life. Invasive species are non-native plants or animals that have been introduced, either intentionally or by accident, and inflict ecological damage to their new environments as they compete for resources and disrupt an established ecosystem. In fact, invasive species rank just behind habitat loss when it comes to biodiversity threats. A 2019 study revealed that out of 953 extinctions since 1500, more than 400 were attributed to invasive species. For example, simply introducing cats to New Zealand in 1769 led to the downfall of the Stephens Island wren by 1900. In more recent times, Florida has banned 16 invasive species, including popular pet iguanas, as a way to reduce ecological and economic damages.
Wildlife Trade
While some invasive species have been inadvertently introduced throughout the centuries, the billion-dollar illegal wildlife trade is another driver — both for introducing invasive species and biodiversity loss. A 2019 study predicted that the wildlife trade threatens almost 9,000 land species with extinction; this trade is the largest illegal market after drugs and weapons, with pangolin scales and elephant tusks among the market’s most popular commodities.
Though not as large of a market, many plant-loving consumers are likely unaware that their latest acquisition could have been sourced via the illegal plant trade.
Hunting
Poaching (illegal hunting) fuels the wildlife trade, but legal hunting is also detrimental to species’ survival. During the Trump administration, many hunting regulations were scaled back, such as allowing hunters to shoot and kill bears and wolves in a wildlife refuge, along with their offspring, in their dens. Yet hunting easements aren’t limited to administrations. Idaho recently passed a bill giving hunters the greenlight to kill 90 percent of the state’s gray wolf population, which would reduce the overall number from around 1,500 to just 150. The endangered threshold is 100.
Overfishing falls into this category as well. Illegal fishing is a common practice, marine sanctuaries have opened up to commercial fishing and large numbers of marine life are getting caught up in fishing nets as unintended bycatch. Consumer demand has caused species such as beluga sturgeon, Atlantic halibut and bluefin tuna to land on the endangered list.
Climate Change
Certainly not least, this vast area encompasses enough issues for a separate discussion. In a nutshell, ever-increasing greenhouse gases are exacerbating the gamut of climate-induced events: rising seas, droughts, floods, wildfires, etc., all of which threaten plant and animal species just as much as they threaten human life.
What’s Being Done About It?
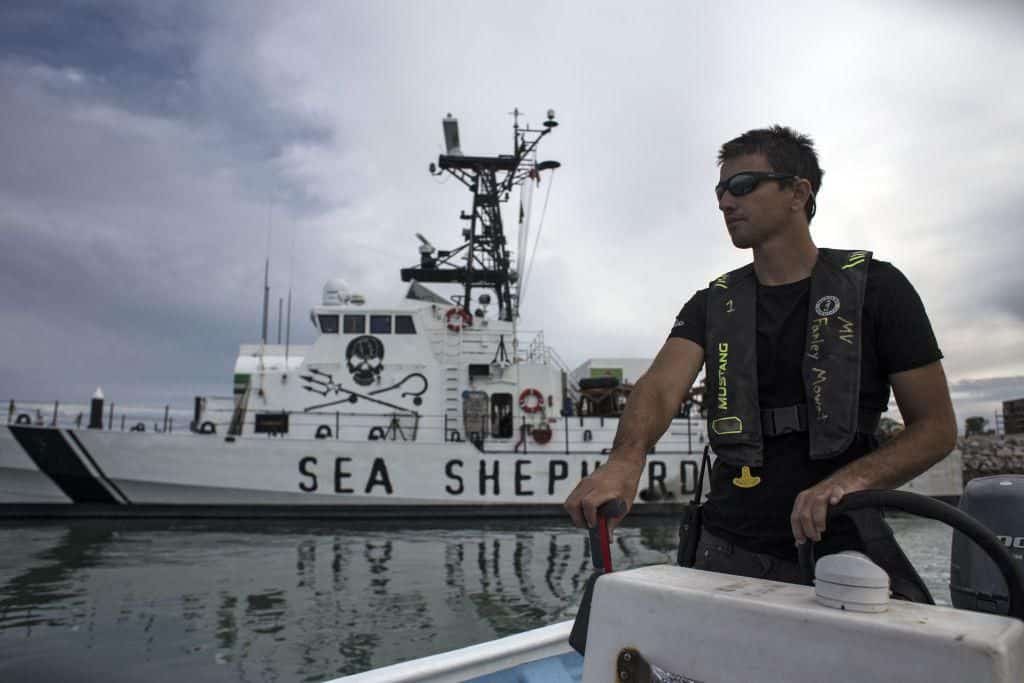
M/V Farley Mowat crew member Tomas, pilots a boat at the port of San Felipe, in the Gulf of California, northwestern Mexico, in 2018, as part of the Sea Shepherd Conservation Society’s operation “Milagro IV” to save the critically endangered vaquita porpoise. GUILLERMO ARIAS / AFP / Getty Images
Despite the many extinction threats facing species, global and local entities are working to address the problem.
Global Action
The Convention on Biological Diversity formed in 1993 to protect biodiversity, and includes 196 participating nations. In 2010, the group set 20 biodiversity goals to meet by 2020. Unfortunately none of those goals have been met, although six targets were partially achieved, such as conserving protected areas and preventing invasive species. A recent UN report determined that it’s not too late for global leaders to take action, but that countries need to focus on sustainability in general, from food systems and oceans to land and infrastructure. The next opportunity for countries to address biodiversity issues will occur in October 2021 in China, when the UN Biodiversity Conference convenes to troubleshoot biodiversity loss.
Biden Administration
U.S. President Joe Biden formally announced a conservation plan in 2021 to protect 30 percent of the country’s land and water by 2030. Additionally, under Biden the U.S. has rejoined the Paris Agreement, ended permitting for the Keystone XL pipeline and halted oil leasing in the Arctic National Wildlife Refuge. Other recent biodiversity wins include Biden’s plan to restore migratory bird protections, however, protecting gray wolves and monarch butterflies is still under review.
Wildlife Conservation/Tourism
There are numerous wildlife groups devoted to conserving biodiversity; some of the major players include the World Wildlife Fund, The Nature Conservancy, National Wildlife Federation, The Sierra Club, National Audubon Society and the Jane Goodall Institute. Meanwhile, conservation tourism remains a growing area, despite experiencing COVID-19 pandemic setbacks. For example, the African Wildlife Foundation has partnered with the Rwandan government to protect endangered mountain gorillas, resulting in a booming tourism industry. Elsewhere in Africa, wildlife safaris and game drives remain a critical way to bolster local economies while protecting species that are favored by poachers, such as rhinos and elephants. By no means limited to Africa, conservation tourism is helping to boost and/or protect the numbers of giant pandas in China, Bengal tigers in India, polar bears in Canada and giant tortoises in the Galapagos.
Captive Breeding
Zoos and animal facilities around the world have been participating in captive breeding programs since the 1960s, which are meant to increase populations of endangered species. While some programs breed animals that will remain in captivity, particularly zoos, others breed with the intention of introducing endangered species back into the wild. Not all attempts have been successful, but there are positive stories. Take the black-footed ferret, a North American species that was declared extinct in 1979. A captivity breeding program launched after 18 were found a couple years later; today, it’s estimated that 301 survive in captivity and another 340 live in the wild. The ferrets are also notable for the fact that they’re the first endangered species in the U.S. to be cloned, raising new hope for not just the ferrets, but other endangered species as well — even those that are extinct, such as the passenger pigeon.
Ocean Conservation
While there’s overlap with general wildlife conservation groups, an equal number of conservation organizations are dedicated to protecting marine life: Oceana, Ocean Conservancy, Sea Shepherd Conservation Society and The Cousteau Society are among those making a difference by addressing pressing issues that involve, but aren’t limited to, overfishing, coral reef bleaching, plastic pollution, commercial whaling and ocean acidification.
What Can We Do?
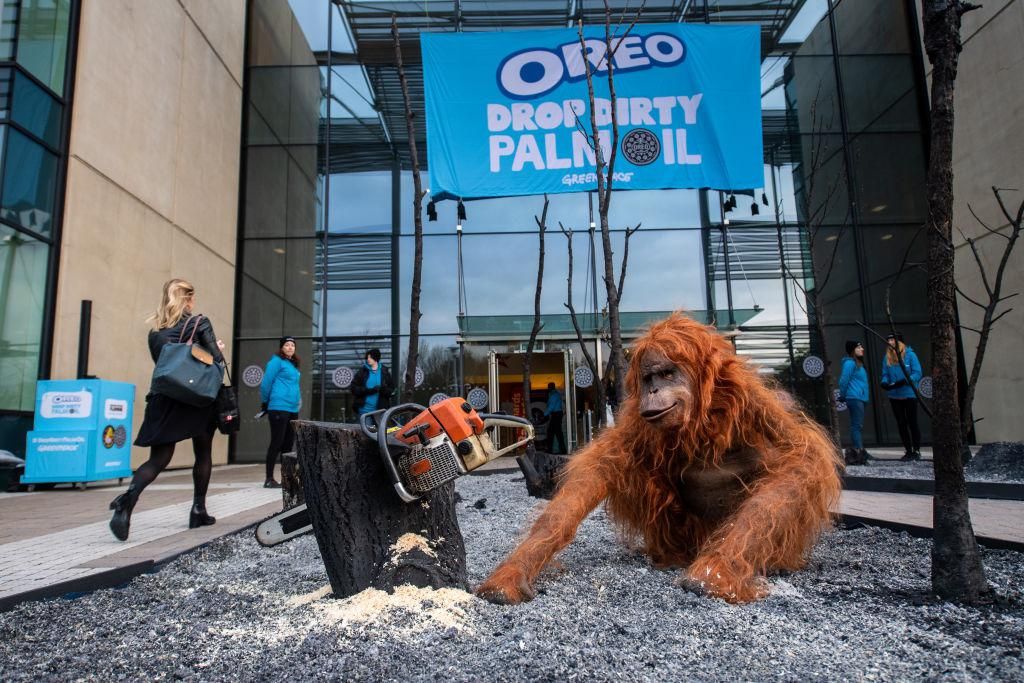
Greenpeace activists create a burnt smoldering rain-forest with a lifelike animatronic orangutan at the headquarters of Oreo cookies, in protest over their use of palm oil on November 19, 2018 in Uxbridge, England. Chris J Ratcliffe / Getty Images
Luckily, there are ways to make an impact on a smaller scale, and the more people that partake in these efforts, the greater the overall effect will be.
Support Sustainable Products and Food
Where possible, choose sustainably made goods, whether that’s organic coffee from producers who eschew pesticides or furniture made from FSC-certified wood. (This designation certifies that the wood was sourced from well-managed forests.) Supporting local, organic farmers is another way to make a difference, along with understanding which types of seafood are more sustainable and being aware of eco-certification labels and what they really mean.
Avoid Palm Oil Products
Palm oil plantations have devastated large swaths of land across Asia, Latin America and Africa, although the majority of this popular vegetable oil is produced in Indonesia and Malaysia. Mass production comes at the expense of endangered species facing habitat loss: the Sumatran elephant, orangutan, rhino and tiger are now among the critically endangered as plantation land expansion continues unchecked. Consumers can fight back by avoiding products made with palm oil; however, this can prove difficult since the ingredient is prevalent in everything from makeup products and laundry detergent to chocolate and soap. Read labels closely, since many items disguise palm oil under other names, or use other names for palm oil derivatives. Vegetable oil, palmate and sodium lauryl sulfate are all clues that a product contains palm oil.
Eat a Plant-Based Diet
Another way to avoid palm oil is by switching to a plant-based diet. But this diet has much larger environmental benefits for biodiversity as it requires far less land usage and reduces reliance on a small number of animal species as a global food source. The world is currently using 80 percent of its agricultural land to raise livestock; consider how much biodiversity could be saved and preserved otherwise.
Become a Citizen Scientist
It’s not uncommon for environmental organizations to seek help from average citizens to participate in all manner of projects. Whether it’s keeping track of cicadas, searching for penguin eggs or identifying coral reef damage, there are programs around the world that welcome assistance. Even better, it’s entirely possible to find projects that can be performed in your own backyard.
Takeaway
The world has reached a critical make-or-break point for preserving a million species at risk for extinction, some within the next few decades. The issue may seem overwhelming, much like climate change, but it’s not hopeless. As with anything related to the environment, getting involved at a local level, learning about the current issues and becoming a conscious consumer are good starting points for fighting back against biodiversity loss.
Meredith Rosenberg is a senior editor at EcoWatch. She holds a Master’s from the Newmark Graduate School of Journalism in NYC and a B.A. from Temple University in Philadelphia.