Hurricane Season 2019: Global Warming, Forecasts and Probabilities

By Astrid Caldas
On May 21, the first named storm of 2019, Andrea, was recorded on the north Atlantic. This makes 2019 the fifth consecutive year that a named storm has formed before the official start of Atlantic hurricane season.
Something caught my eye when I read that: the number five. That's because, according to NASA, 2018 was the fourth warmest year in a continued warming trend since record keeping began in the 1880's, with temperatures 1.5 degrees Fahrenheit (0.83 degrees Celsius) warmer than the 1951 to 1980 mean. And with it, a string of five consecutive years have been recorded as the five warmest on record. I will say this again: the last five years have been the five warmest years on record.
Is climate change having an effect on hurricane season, or on hurricanes themselves? Hurricane season starts on June 1st. Let's take a look at the latest forecasts and science.
Hurricane Forecasts and Their Messages
On April 16, Colorado State University (CSU) released its hurricane outlook for the 2019 season, forecasting 13 named storms with 5 of them turning into hurricanes, of which 2 would classify as major (categories 3 and above).
On May 23, the National Hurricane Center, part of the National Atmospheric and Oceanic Administration (NOAA) released their forecast, predicting a "near-normal" season with 9 to 15 named storms and 4 to 8 hurricanes, with 2 to 4 being major ones. An average season has 12 named storms, six hurricanes and three major hurricanes. The numbers are very similar to the ones from CSU.
The odds for that near-normal season are 40%. Odds for above-normal or below-normal activity are both at 30%. But, as I mentioned last year, odds are not certain predictions. They are just that: odds (see below for more on that). And the last couple of years certainly reminded us of that.
Years to Remember – in More Than One Way
NOAA's forecast for the 2018 season also had a near-normal probability of 40%, with 35% odds of it being above normal, and 25% odds of being below-normal. It forecast 10 to 16 named storms and 5 to 9 hurricanes, with 1 to 4 being major. What we saw was a season tilted toward the higher side of the predictions — there were 15 named storms and eight hurricanes. Two of those were major, and two hurricanes — Michael and Florence, the latter not a major hurricane but a category 1 — caused roughly $50 billion in estimated damage.
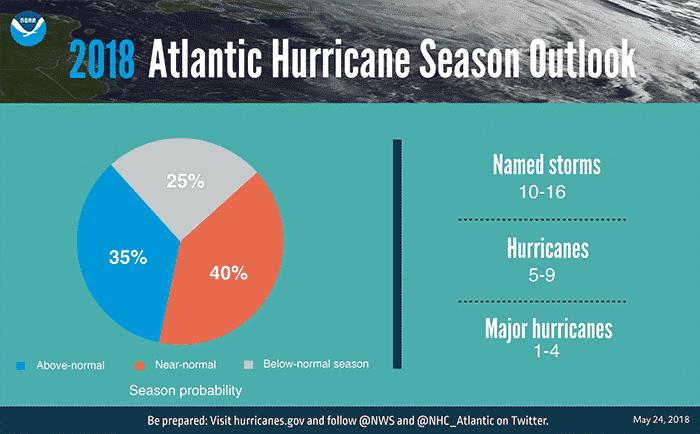
While the probabilistic predictions may not have raised any eyebrows, when a record four hurricanes were active at the same time, that caught my eye.
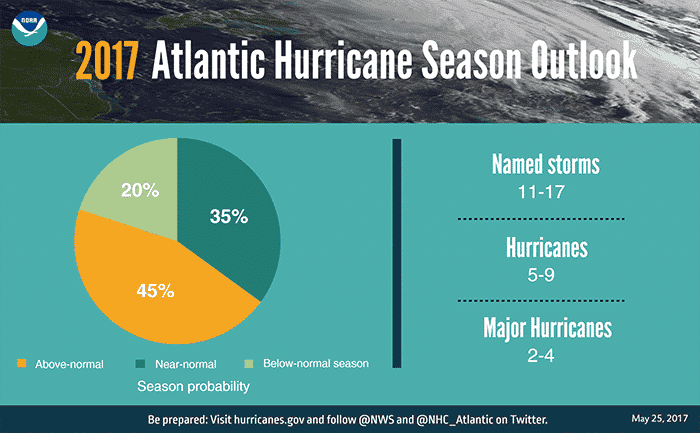
If we look further back, at 2017, the probability of an above-normal season was at 45%, and below-normal activity was at 20%. The forecast called for 5 to 9 hurricanes, with 2 to 5 being major — and the reality blew the predictions: we had 10 hurricanes with 6 major ones. Three of these major ones hit the U.S., and nobody will forget the string of names Harvey, Irma and Maria anytime soon. That also caught my eye.
However, I was not surprised when the numbers fell outside of the given range.
Understanding the Forecast
That is because the range in numbers given in NOAA's forecast has a 70% probability, meaning that "The seasonal activity is expected to fall within these ranges in 7 out of 10 seasons with similar climate conditions and uncertainties to those expected this year. They do not represent the total possible ranges of activity seen in past similar years." So, there you have it, in plain language, that the actual numbers for 2019 (as in any season) may be different from the ones in the forecast.
What Do These Seasons Tell Us?
Forecasts are based on probabilities calculated from conditions at the time of the forecast, and as such, there is ample room for conditions to change and actual facts to fall outside the probabilistic calculations, as the numbers for 2017 show. At the time of the 2018 forecast, sea surface temperatures were running below average in the area where tropical storms form, and the forecast was based on those conditions. For this year, NOAA stated that there are competing signals affecting the forecast: an ongoing weak El Niño is expected to suppress intensity of Atlantic hurricane activity, while warmer-than-average surface waters and an enhanced African monsoon are forces that could lead to increased activity. Will these conditions change and affect hurricane activity? Probably. That is also why NOAA releases an updated forecast later in the season, usually in early August. Mind you, the updated forecast is based on the same probabilistic calculations, only using updated conditions.
Most importantly, it only takes one hurricane to hit to cause possible devastation. Nobody can tell ahead of time how many hurricanes in a season will strike land. One should always remember that, and be prepared, such as by following the NOAA/NWS storm tracking page and FEMA hurricane preparation guidance. And with the last couple of seasons seeing major hurricanes (some making landfall), preparedness takes on a new urgency.
But are we really seeing more of these major hurricanes, or is it just an impression — or coincidence?
Hurricanes Are Getting Stronger
The fact is that global warming is loading the dice when it comes to hurricane strength, with abnormally warm water being one of the culprits because it has the potential to increase hurricane power. Two of the most powerful hurricanes in recent history, Harvey and Florence, gained immense strength in very little time, and one of the reasons was that the sea surface temperature of the water in its path was running well above normal. In the case of Harvey, Gulf waters were warmer than any time on record, and temperatures along Florence's path were 3.6°F (2°C) hotter than normal. That warmer water is linked to human-caused warming due to emissions from burning coal, oil and gas. And it is worth noting that, after further analysis, hurricane Michael was upgraded to a category 5 in April 2019, months after it hit in 2018.
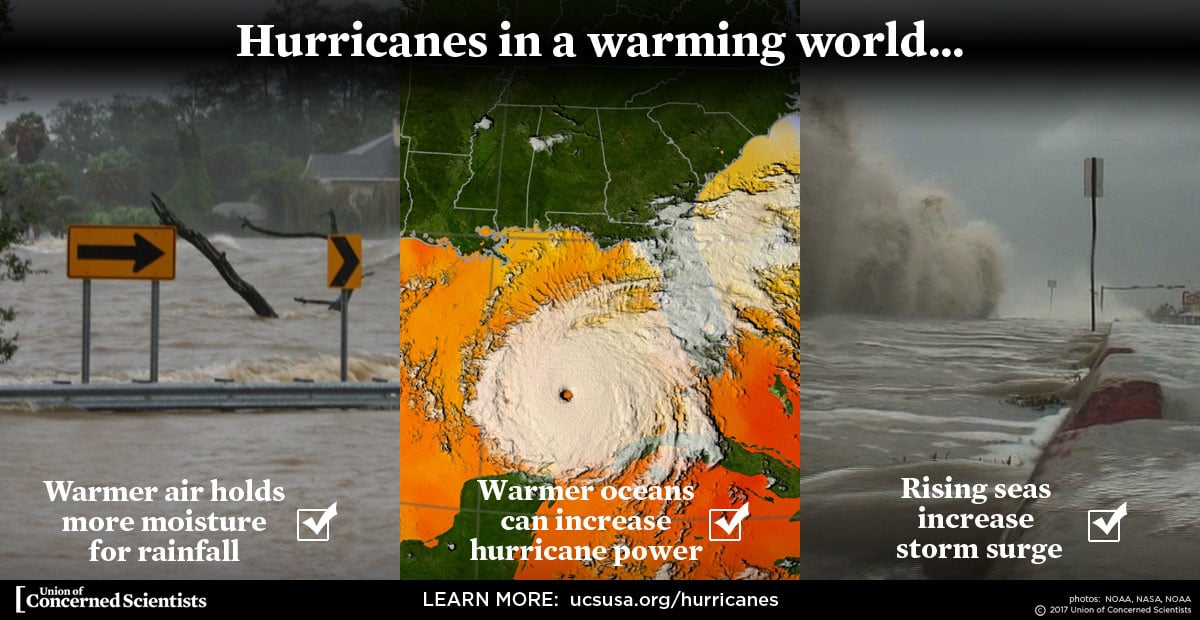
But it is not just the wind and strength of a hurricane that are amplified by climate change: global warming can also increase the amount of rain that hurricanes bring. Warmer air holds more moisture (read: more water to fall when it rains), and global average temperature is currently about 1.8°F (1°C) warmer than it was in the late 1800s. In fact, a study found that the record rainfall from Harvey was roughly three times more likely and 15% more intense than in a world without global warming. Another study found that higher ocean heat content and sea surface temperatures make hurricanes such as Harvey "more intense, bigger, and longer lasting and greatly increase their flooding rains."
Furthermore, research suggests that there has been an increase in intense hurricane activity over the past 40 years, and since the mid-1970s the number of strong hurricanes reaching categories 3 and above has roughly doubled.
So, while we wait for this hurricane season to develop, let's be mindful of probabilities, a changing climate, changing conditions, and most of all, preparedness. It reduces risks, helps ensure communities withstand the next storm, and can save lives.
#ClimateChange Is Already Making #Hurricanes Wetter, Study Confirms https://t.co/ngztLITdyC @ClimateCentral @ClimateNexus
— EcoWatch (@EcoWatch) November 16, 2018
Astrid Caldas is a climate scientist with the Climate & Energy program at the Union of Concerned Scientists.
- How Rural Areas Like Florida's Panhandle Can Become More ... ›
- Early Forecasts Suggest 'Quiet' 2019 Hurricane Season - EcoWatch ›
Thousands of Superfund sites exist around the U.S., with toxic substances left open, mismanaged and dumped. Despite the high levels of toxicity at these sites, nearly 21 million people live within a mile of one of them, according to the U.S. Environmental Protection Agency (EPA).
Currently, more than 1,300 Superfund sites pose a serious health risk to nearby communities. Based on a new study, residents living close to these sites could also have a shorter life expectancy.
Published in Nature Communications, the study, led by Hanadi S. Rifai, a professor of civil and environmental engineering at the University of Houston, and a team of researchers, found that living in nearby zip codes to Superfund sites resulted in a decreased life expectancy of more than two months, the University of Houston reported.
"We have ample evidence that contaminant releases from anthropogenic sources (e.g., petrochemicals or hazardous waste sites) could increase the mortality rate in fence-line communities," Rifai told the University of Houston. "Results showed a significant difference in life expectancy among census tracts with at least one Superfund site and their neighboring tracts with no sites."
The study pulled data from 65,000 census tracts – defined geographical regions – within the contiguous U.S., The Guardian reported. With this data, researchers found that for communities that are socioeconomically challenged, this life expectancy could decrease by up to a year.
"It was a bit surprising and concerning," Rifai told The Guardian. "We weren't sure [when we started] if the fact that you are socioeconomically challenged would make [the Superfund's effects] worse."
The research team, for example, found that the presence of a Superfund site in a census tract with a median income of less than $52,580 could reduce life expectancy by seven months, the University of Houston reported.
Many of these toxic sites were once used as manufacturing sites during the Second World War. Common toxic substances that are released from the sites into the air and surface water include lead, trichlorethylene, chromium, benzene and arsenic – all of which can lead to health impacts, such as neurological damage among children, The Union of Concerned Scientists wrote in a blog.
"The EPA has claimed substantial recent progress in Superfund site cleanups, but, contrary to EPA leadership's grandiose declarations, the backlog of unfunded Superfund cleanups is the largest it has been in the last 15 years," the Union wrote.
Delayed cleanup could become increasingly dangerous as climate change welcomes more natural hazards, like wildfires and flooding. According to a Government Accountability Office report, for example, climate change could threaten at least 60 percent of Superfund sites in the U.S., AP News reported.
During the summer of 2018, a major wildfire took over the Iron Mountain Superfund site near Redding, CA, ruining wastewater treatment infrastructure that is responsible for capturing 168 million gallons of acid mine drainage every month, NBC News reported.
"There was this feeling of 'My God. We ought to have better tracking of wildfires at Superfund locations,'" Stephen Hoffman, a former senior environmental scientist at the EPA, told NBC News. "Before that, there wasn't a lot of thought about climate change and fire. That has changed."
In the study, researchers also looked at the impacts of floodings on Superfund sites, which could send toxins flowing into communities and waterways.
"When you add in flooding, there will be ancillary or secondary impacts that can potentially be exacerbated by a changing future climate," Rifai told the University of Houston. "The long-term effect of the flooding and repetitive exposure has an effect that can transcend generations."
- Biden Faces Pressure to Tackle 'Unfunded' Toxic Waste Sites ... ›
- Do You Live Near One of the 1,300 Most Toxic Sites in America ... ›
- EPA Adds Prison Locations to Its Environmental Justice Mapping ... ›
- EPA: Houston Superfund Site Leaked Toxic Chemicals After Harvey ... ›
A weather research station on a bluff overlooking the sea is closing down because of the climate crisis.
The National Weather Service (NWS) station in Chatham, Massachusetts was evacuated March 31 over concerns the entire operation would topple into the ocean.
"We had to say goodbye to the site because of where we are located at the Monomoy Wildlife Refuge, we're adjacent to a bluff that overlooks the ocean," Boston NWS meteorologist Andy Nash told WHDH at the time. "We had to close and cease operations there because that bluff has significantly eroded."
Chatham is located on the elbow of Cape Cod, a land mass extending out into the Atlantic Ocean that has been reshaped and eroded by waves and tides over tens of thousands of years, The Guardian explained. However, sea level rise and extreme weather caused by the climate crisis have sped that change along.
"It's an extremely dynamic environment, which is obviously a problem if you are building permanent infrastructure here," Andrew Ashton, an associate scientist at Cape-Cod based Woods Hole Oceanographic Institution, told The Guardian. "We are putting our foot on the accelerator to make the environment even more dynamic."
This was the case with the Chatham weather station. It used to be protected from the drop into the ocean by about 100 feet of land. However, storm action in 2020 alone washed away as much as six feet of land a day.
"We'd know[n] for a long time there was erosion but the pace of it caught everyone by surprise," Nash told The Guardian. "We felt we had maybe another 10 years but then we started losing a foot of a bluff a week and realized we didn't have years, we had just a few months. We were a couple of storms from a very big problem."
The Chatham station was part of a network of 92 NWS stations that monitor temperature, pressure, humidity, wind speed and direction and other data in the upper atmosphere, The Cape Cod Chronicle explained. The stations send up radiosondes attached to weather balloons twice a day to help with weather research and prediction. The Chatham station, which had been observing this ritual for the past half a century, sent up its last balloon the morning of March 31.
"We're going to miss the observations," Nash told The Cape Cod Chronicle. "It gives us a snapshot, a profile of the atmosphere when the balloons go up."
The station was officially decommissioned April 1, and the two buildings on the site will be demolished sometime this month. The NWS is looking for a new location in southeastern New England. In the meantime, forecasters will rely on data from stations in New York and Maine.
Nash said the leavetaking was bittersweet, but inevitable.
"[M]other nature is evicting us," he told The Cape Cod Chronicle.
By Douglas Broom
- If online deliveries continue with fossil-fuel trucks, emissions will increase by a third.
- So cities in the Netherlands will allow only emission-free delivery vehicles after 2025.
- The government is giving delivery firms cash help to buy or lease electric vehicles.
- The bans will save 1 megaton of CO2 every year by 2030.
Cities in the Netherlands want to make their air cleaner by banning fossil fuel delivery vehicles from urban areas from 2025.
"Now that we are spending more time at home, we are noticing the large number of delivery vans and lorries driving through cities," said Netherlands environment minister Stientje van Veldhoven, announcing plans to ban all but zero-emission deliveries in 14 cities.
"The agreements we are setting down will ensure that it will be a matter of course that within a few years, supermarket shelves will be stocked, waste will be collected, and packages will arrive on time, yet without any exhaust fumes and CO2 emissions," she added.
She expects 30 cities to announce zero emission urban logistics by this summer. City councils must give four years' notice before imposing bans as part of government plans for emission-free road traffic by 2050. The city bans aim to save 1 megaton of CO2 each year by 2030.
Help to Change
To encourage transport organizations to go carbon-free, the government is offering grants of more than US$5,900 to help businesses buy or lease electric vehicles. There will be additional measures to help small businesses make the change.
The Netherlands claims it is the first country in the world to give its cities the freedom to implement zero-emission zones. Amsterdam, Rotterdam and Utrecht already have "milieuzones" where some types of vehicles are banned.
Tilburg, one of the first wave of cities imposing the Dutch ban, will not allow fossil-fuelled vehicles on streets within its outer ring road and plans to roll out a network of city-wide electric vehicle charging stations before the ban comes into effect in 2025.
"Such initiatives are imperative to improve air quality. The transport of the future must be emission-free, sustainable, and clean," said Tilburg city alderman Oscar Dusschooten.
Europe Takes Action
Research by Renault shows that many other European cities are heading in the same direction as the Netherlands, starting with Low Emission Zones of which Germany's "Umweltzone" were pioneers. More than 100 communes in Italy have introduced "Zonas a traffico limitato."
Madrid's "zona de baja emisión" bans diesel vehicles built before 2006 and petrol vehicles from before 2000 from central areas of the city. Barcelona has similar restrictions and the law will require all towns of more than 50,000 inhabitants to follow suit.
Perhaps the most stringent restrictions apply in London's Ultra Low Emission Zone (ULEZ), which charges trucks and large vehicles up to US$137 a day to enter the central area if they do not comply with Euro 6 emissions standards. From October, the ULEZ is being expanded.
Cities are responsible for around 75% of CO2 emissions from global final energy use, according to the green thinktank REN21 - and much of these come from transport. Globally, transport accounts for 24% of world CO2 emissions.
The Rise of Online Shopping
Part of the reason for traffic in urban areas is the increase in delivery vehicles, as online shopping continues to grow. Retailer ecommerce sales are expected to pass $5billion in 2022, according to eMarketer.
The World Economic Forum's report The Future of the Last-Mile Ecosystem, published in January 2020, estimates that e-commerce will increase the number of delivery vehicles on the roads of the world's 100 largest cities by 36% by 2030.
If all those vehicles burn fossil fuels, the report says emissions will increase by 32%. But switching to all-electric delivery vehicles would cut emissions by 30% from current levels as well as reducing costs by 25%, the report says.
Other solutions explored in the report include introducing goods trams to handle deliveries alongside their passenger-carrying counterparts and increased use of parcel lockers to reduce the number of doorstep deliveries.
Reposted with permission from the World Economic Forum.
A bill that would have banned fracking in California died in committee Tuesday.
The bill, SB467, would have prohibited fracking and other controversial forms of oil extraction. It would also have banned oil and gas production within 2,500 feet of a home, school, hospital or other residential facility. The bill originally set the fracking ban for 2027, but amended it to 2035, The AP reported.
"Obviously I'm very disappointed," State Sen. Scott Wiener (D-San Francisco), one of the bill's two introducers, told the Los Angeles Times. "California really has not done what it needs to do in terms of addressing the oil problem. We have communities that are suffering right now, and the Legislature has repeatedly failed to act."
The bill was introduced after California Gov. Gavin Newsom said he would sign a fracking ban if it passed the legislature, though his administration has continued to issue permits in the meantime, Forbes reported. Newsom has also spoken in favor of a buffer zone between oil and gas extraction and places where people live and learn, according to the Los Angeles Times. The latter is a major environmental justice issue, as fossil fuel production is more likely to be located near Black and Latinx communities.
Urban lawmakers who want California to lead on the climate crisis supported the bill, while inland lawmakers in oil-rich areas concerned about jobs opposed it. The oil and gas industry and trade unions also opposed the bill.
This opposition meant the bill failed to get the five votes it needed to move beyond the Senate's Natural Resources and Water Committee. Only four senators approved it, while Democrat Sen. Susan Eggman of Stockton joined two Republicans to oppose it, and two other Democrats abstained.
Eggman argued that the bill would have forced California to rely on oil extracted in other states.
"We're still going to use it, but we're going to use it from places that produce it less safely," Eggman told The AP. She also said that she supported the transition away from fossil fuels, but thought the bill jumped the gun. "I don't think we're quite there yet, and this bill assumes that we are," she added.
Historically, California has been a major U.S. oil producer. Its output peaked in 1986 at 1.1 million barrels a day, just below Texas and Alaska, according to Forbes. However, production has declined since then making it the seventh-most oil-producing state.
Still, California's fossil fuel industry is at odds with state attempts to position itself as a climate leader.
"There is a large stain on California's climate record, and that is oil," Wiener said Tuesday, according to The AP.
Wiener and Democrat co-introducer Sen. Monique Limón from Santa Barbara vowed to keep fighting.
"While we saw this effort defeated today, this issue isn't going away," they wrote in a joint statement. "We'll continue to fight for aggressive climate action, against harmful drilling, and for the health of our communities."
- What the Industry Doesn't Want You to Know About Fracking ... ›
- Final EPA Study Confirms Fracking Contaminates Drinking Water ... ›
- Pennsylvania Fracking Water Contamination Much Higher Than ... ›
World's 5% 'Polluter Elite' Responsible for 37% of Global Emissions Growth, Study Concludes
By Brett Wilkins
As world leaders prepare for this November's United Nations Climate Conference in Scotland, a new report from the Cambridge Sustainability Commission reveals that the world's wealthiest 5% were responsible for well over a third of all global emissions growth between 1990 and 2015.
The report, Changing Our Ways: Behavior Change and the Climate Crisis, found that nearly half the growth in absolute global emissions was caused by the world's richest 10%, with the most affluent 5% alone contributing 37%.
"In the year when the UK hosts COP26, and while the government continues to reward some of Britain's biggest polluters through tax credits, the commission report shows why this is precisely the wrong way to meet the UK's climate targets," the report's introduction states.
The authors of the report urge United Kingdom policymakers to focus on this so-called "polluter elite" in an effort to persuade wealthy people to adopt more sustainable behavior, while providing "affordable, available low-carbon alternatives to poorer households."
The report found that the "polluter elite" must make "dramatic" lifestyle changes in order to meet the UK's goal — based on the Paris climate agreement's preferential objective — of limiting global heating to 1.5°C, compared with pre-industrial levels.
In addition to highlighting previous recommendations — including reducing meat consumption, reducing food waste, and switching to electric vehicles and solar power — the report recommends that policymakers take the following steps:
- Implement frequent flyer levies;
- Enact bans on selling and promoting SUVs and other high polluting vehicles;
- Reverse the UK's recent move to cut green grants for homes and electric cars; and
- Build just transitions by supporting electric public transport and community energy schemes.
"We have got to cut over-consumption and the best place to start is over-consumption among the polluting elites who contribute by far more than their share of carbon emissions," Peter Newell, a Sussex University professor and lead author of the report, told the BBC.
"These are people who fly most, drive the biggest cars most, and live in the biggest homes which they can easily afford to heat, so they tend not to worry if they're well insulated or not," said Newell. "They're also the sort of people who could really afford good insulation and solar panels if they wanted to."
Newell said that wealthy people "simply must fly less and drive less. Even if they own an electric SUV, that's still a drain on the energy system and all the emissions created making the vehicle in the first place."
"Rich people who fly a lot may think they can offset their emissions by tree-planting schemes or projects to capture carbon from the air," Newell added. "But these schemes are highly contentious and they're not proven over time."
The report concludes that "we are all on a journey and the final destination is as yet unclear. There are many contradictory road maps about where we might want to get to and how, based on different theories of value and premised on diverse values."
"Promisingly, we have brought about positive change before, and there are at least some positive signs that there is an appetite to do what is necessary to live differently but well on the planet we call home," it states.
The new report follows a September 2020 Oxfam International study that revealed the wealthiest 1% of the world's population is responsible for emitting more than twice as much carbon dioxide as the poorest 50% of humanity combined.
Reposted with permission from Common Dreams.
- Small Percentage of Frequent Flyers Are Driving Global Emissions ... ›
- World's Richest People Gained $1.8 Trillion in 2020 - EcoWatch ›
- Tourism Responsible for 8% of Global Greenhouse Gas Emissions ... ›