
 568k
568k  233k
233k  41k
41k  Subscribe
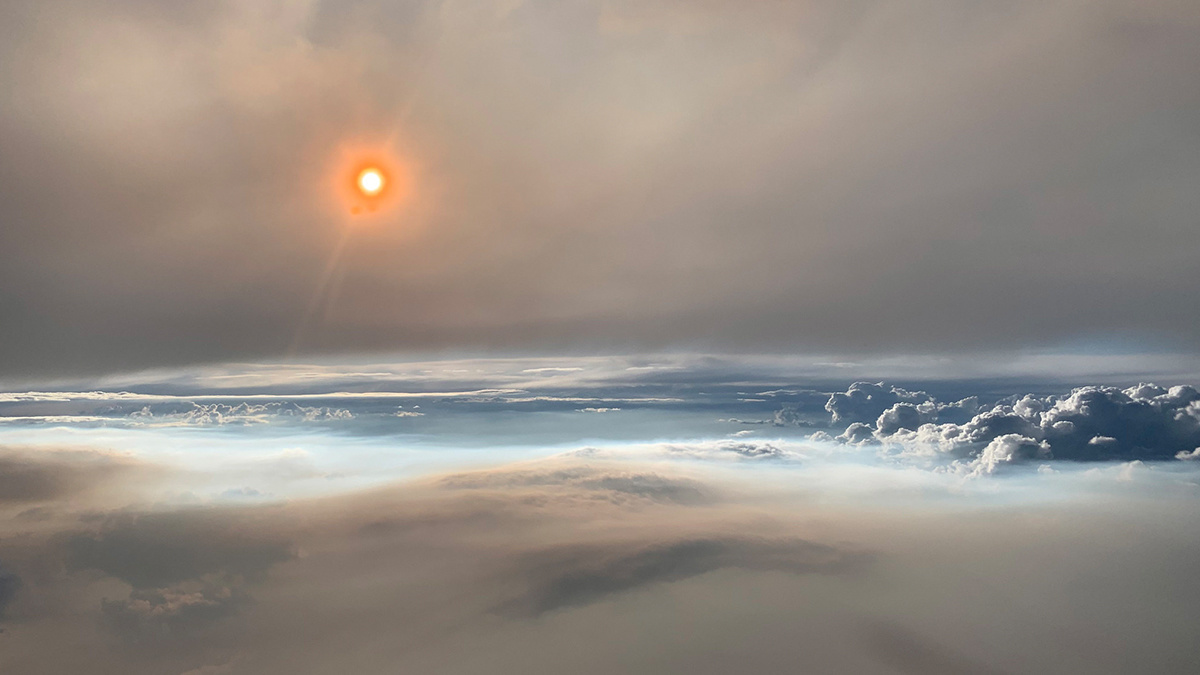
On Aug. 8 atmospheric scientists from NOAA and NASA got a rare look at "fire clouds" as they were forming. NASA Earth Observatory image by Joshua Steven
A bleak new federal report found that carbon dioxide in the atmosphere rose to levels the world has not seen in at least 800,000 years, highlighting the irreversible and mounting deleterious effects of human activity on the planet, as ABC News reported.
Global carbon dioxide concentrations reached a record of 407.4 parts per million during 2018, the study found. That is 2.4 ppm greater than 2017 and “the highest in the modern instrumental record and in ice core records dating back 800,000 years,” the report said, according to CNN.
It wasn’t just the amount of carbon dioxide that set record levels. Other greenhouse gases like methane and nitrous oxide also continued a rapid rise into the atmosphere. Together, the global warming power of greenhouse gases was 43 percent stronger than in 1990, according to the State of the Climate report released Monday by the American Meteorological Society, a division of the National Oceanic and Atmospheric Administration’s (NOAA) National Centers for Environmental Information.
Greenhouse gases are not the only thing rising. Global sea levels also reached their highest levels on record for the seventh consecutive year, as ABC News reported. The report says that ocean levels are rising about an inch per decade, but that number may need to be revised if ice melt at the poles accelerates.
For global temperatures, 2018 ranked fourth, behind 2016, 2015 and 2017 for the warmest on record. That top four finish for 2018 is despite a La Niña system over the Pacific that cooled ocean waters for part of the year.
So far, 2019 is on track to be the warmest year in recorded history, according to NOAA.
Global sea temperatures also set a record level in 2018. “This record heat reflects the continuing accumulation of thermal energy in the top 2,300 feet (700 meters) of the ocean,” according to NOAA. “Oceans absorb more than 90 percent of Earth’s excess heat from global warming.”
The State of the Climate report noted that glaciers continued to melt at an alarming rate for the 30th consecutive year, as CNN reported.
“Every year since the start of the 21st Century has been warmer than the 1981-2010 average,” the report said, as CNN reported. “In 2018, the dominant greenhouse gases released into Earth’s atmosphere — carbon dioxide, methane, and nitrous oxide — continued to increase and reach new record highs.”
The 29th annual release of the State of the Climate report was led by NOAA National Centers for Environmental Information and relies on contributions from more than 470 scientists from nearly 60 countries around the world. It incorporates tens of thousands of measurements from multiple independent datasets and provides a detailed update on global climate indicators and notable weather events, according to NOAA.
“This is yet another in a series of expert, science-based reports that continue to sound the alarm about the climate crisis,” said Marshall Shepherd, a professor of geography and atmospheric sciences at the University of Georgia and former president of the American Meteorological Society, to CNN. “[The] DNA of climate change is clearly seen now in our weather, agriculture productivity, water supply challenges, public health, and even national security concern.”
“The findings from their State of the Climate report rise above some blog or opinion on social media,” Shepherd added. “Through the process of science, they are sounding an alarm about the ‘here-and-now’ climate crises.”