568k
568k  233k
233k  41k
41k  Subscribe
What is fracking?
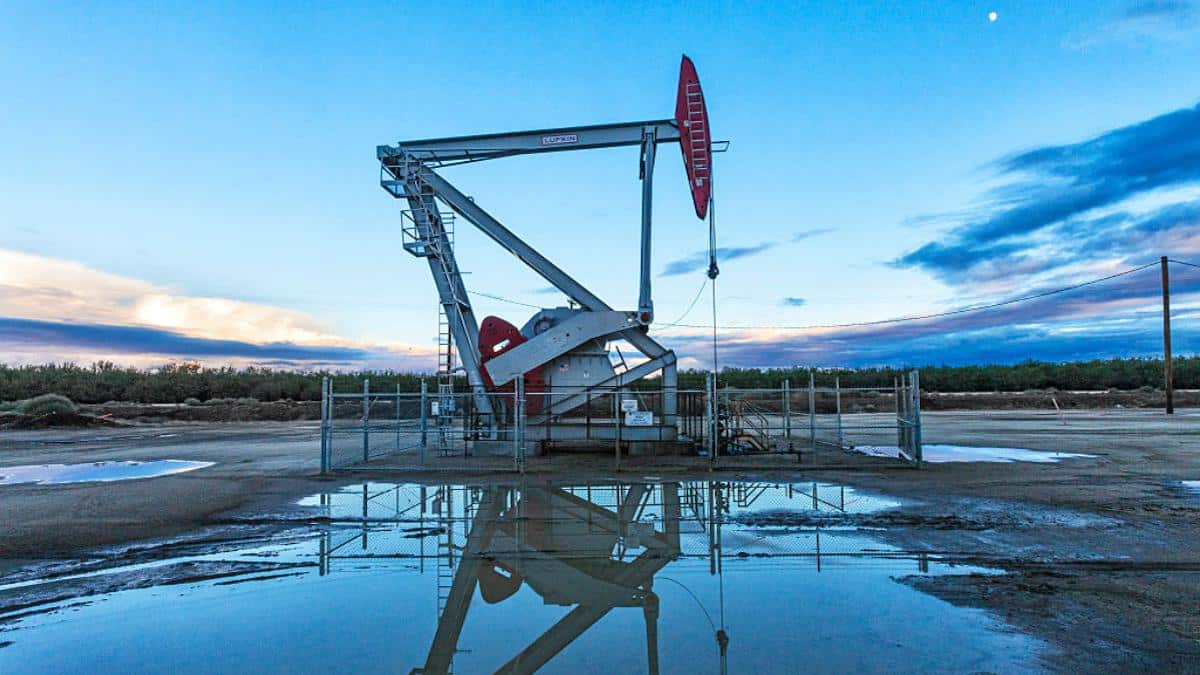
Fracking is a process of blasting water, chemicals and frac sand deep into the earth to break up sedimentary rock and access natural gas and crude oil deposits. The fracking industry, which has sought to promote the practice as safe and controlled, has preferred the term “hydraulic fracturing.”
Fracking emerged as an unconventional, “relatively new” and extremely popular technique only about 20 years ago in the U.S., after advances in technology gave it an unprecedented ability to identify and extract massive amounts of resources efficiently.
Fracking is one of the most important environmental issues today, and it’s a prime example of how a new technology that offers immediate economic and political benefits can outpace (often less obvious) environmental and health concerns.
Why is fracking so controversial?
Modern fracking emerged so quickly, faster than its impacts were understood. Just as importantly, once scientists, health experts and the public started to object with evidence of harm it was causing, business and government succeeded in perpetuating a message of uncertainty, that more research was necessary, further enabling the “full speed ahead” fracking juggernaut.
How does fracking impact the environment?
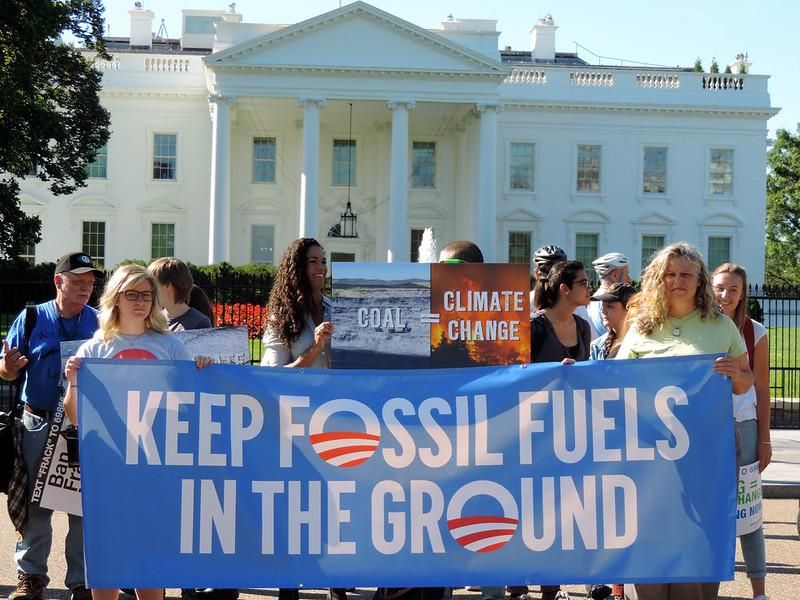
Fracking’s supporters have pushed an environmental angle, insisting that natural gas can be a “bridge fuel,” a cheaper, cleaner option than coal before we have a large-scale transition to renewable energy. This claim has some merit, as natural gas does emit much less carbon dioxide than coal or oil. However, it is still a fossil fuel, adding harmful emissions while the climate crisis worsens. Moreover, fracking wells leak methane, a greenhouse gas more than 25 times more potent than CO2.
Water
In order to break up rock formations one to two miles deep, a fracking operation requires millions of gallons amount of water. After it’s used, the resulting wastewater, which contains chemicals is pumped back into injection wells, sent to treatment plants, or can be dangerously dumped or spilled.
In 2016 the U.S. Environmental Protection Agency (EPA) released a report skewed friendly to industry in its language: Hydraulic Fracturing for Oil and Gas: Impacts from the Hydraulic Fracturing Water Cycle on Drinking Water Resources in the United States. The EPA acknowledged that drinking water contamination was possible, but ultimately came to this conclusion: “Data gaps and uncertainties limited EPA’s ability to fully assess the potential impacts on drinking water resources locally and nationally.”
Earthquakes
According to the U.S. Geologic Survey, disposal of wastewater has caused an increase in earthquakes in the central U.S. Seismologists have reported that fracking’s initial blasting process can trigger earthquakes.
Air Pollution
In addition to methane, fracking releases many toxic contaminants into the air. EPA has acknowledged the public health threat, but a lack of urgent political pressure has sidelined the agency into advising on ways to control and reduce, rather than eliminate, the danger.
Toxic Chemicals
Fracking fluids contain unknown chemicals and known carcinogens such as benzene. Fracking companies haven’t been required to disclose their proprietary formulas, however. This is yet another example of how uncertainty serves as an enabling force. The EPA has identified more than 1,000 different chemicals used in fracking fluid.
Wildlife
Fracking can destroy wildlife habitats, pollute rivers and fisheries, poison birds, and use up water supplies that animals need to survive.
How does fracking affect the economy?
The fracking boom made the U.S. the world’s largest producer of oil and gas, reducing its energy imports from 26% to less than 4%. It has lowered oil and gas prices and created thousands of industry jobs. While fracking companies profited greatly at first, as prices dropped their margins collapsed. Many are now going bankrupt.
How is fracking regulated?
Congress has enabled the oil and gas industry to be exempt from such regulations as the Clean Air Act, the Clean Water Act, and the Safe Drinking Water Act.
Fracking surged during the Obama administration, which moved to protect water from fracking on federal lands in 2015. Subsequently, the Trump administration sought to roll back protections and expand fracking on federal lands.
Key Examples of Fracking in the United States
Pennsylvania
Pennsylvania’s Marcellus Shale is the source for about 40% of shale gas production in the U.S.
New York
While the Marcellus Shale also runs through New York, the state has banned fracking.
Texas
Texas produces more crude oil than any other state.
North Dakota
The Bakken Shale in North Dakota has been one of the main sites for the fracking boom and subsequent bust, leaving behind extensive environmental damage.
A recent report found that all 50 states could provide 100% (or even greater) in-state renewable energy.
Other Countries
Outside the U.S., only Canada, China and Argentina have commercial fracking operations. A UN report in 2018 said that other countries were “highly unlikely” to produce at such a large scale as the U.S., due to political and cultural factors, and existing infrastructure.
The Future of Fracking
While renewables were considered a solution for “peak oil” only a decade ago, fracking changed the terms of the debate, with a new focus from environmentalists to “keep it in the ground” starting in 2015.
The Biden administration now stands at a pivotal moment in the climate crisis. Biden’s stance on fracking is not yet entirely clear, but he has rejoined the Paris agreement and appears to take climate seriously. At the same time, he is sympathetic to workers in fossil fuel industries, was vice president during the fracking boom years under Obama, and may be more inclined to seek a gradual transition than one fast enough to help solve the crisis.