
 568k
568k  233k
233k  41k
41k  Subscribe
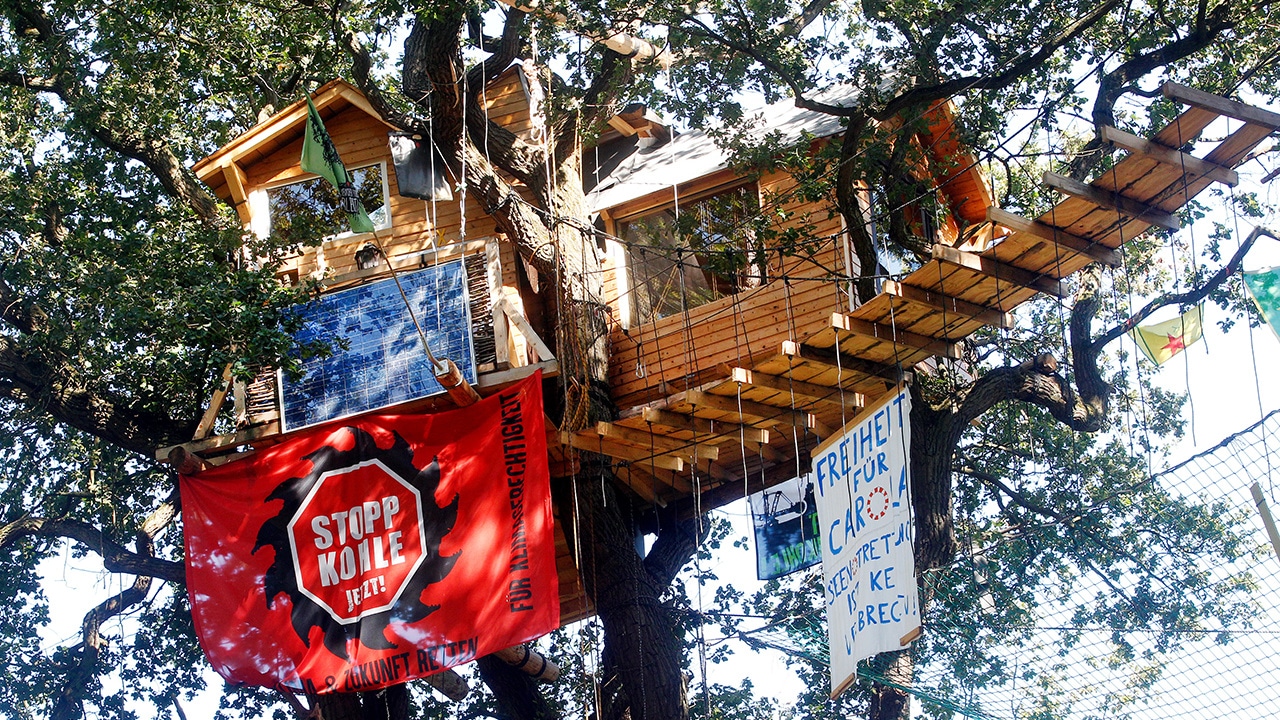
On September 4, 2019, a tree house with solar collectors has been rebuilt by the residents in the Hambach forest. Roland Weihrauch / picture alliance / Getty Images
By Jeannette Cwienk
Shubham Mani Tripathi, newspaper reporter, India: shot dead in June 2020 for exposing illegal sand mining. Maria Efigenia Vasquez Astudillo, radio reporter, Colombia: struck and killed by a projectile in October 2017 while covering clashes between the Indigenous community and local police. Joseph Oduha, journalist, South Sudan: fled the country in 2019 after imprisonment and torture for uncovering environmental destruction by international oil companies.
These are just three of the individuals highlighted by Reporters without Borders (RSF). According to the press freedom group, at least 20 journalists have died over the past decade as a result of their reporting on cases of environmental destruction.
Indigenous Communities Threatened
Environmental journalists in Europe also face intimidation and harassment, said RSF spokesperson Christoph Dreyer, pointing to cases connected to the destruction of the Hambach Forest in northwestern Germany or unsustainable agriculture practices in Brittany, France. But most of these attacks, more than 65%, are recorded in Asia and the Americas.
“These cases exist in places where raw materials are being mined or where land is being seized for agriculture, in countries where the government is on the side of industry,” said Dreyer.
It’s in these areas, where Indigenous communities often live amid untapped natural resources and unspoiled forest, where local journalists are usually the first to report on the conflicts. Often, they’re the only ones on the scene.”
In some Latin American countries, the dominant traditional media are heavily controlled by the economic and political elites,” said Dreyer. “They often hold back from critical reporting on environmental issues, because it clashes with their interests.” As a result, when local media decide to take a closer look they’re put under extreme pressure, he added.
Local Journalists Under Pressure
The work of local journalists is extremely important for Indigenous communities, said Kathrin Wessendorf, head of the International Work Group for Indigenous Affairs (IWGIA). “Each Indigenous community has its own language, and only community reporters can report in that language,” she told DW. “They also know how best to approach the community to spread the message.”
Patricia Gualinga, who fights for Indigenous rights in Ecuador, told DW that large national media networks are often slow to report on environmental and human rights issues. “It’s really very difficult to get coverage on TV. And if an issue isn’t reported by the media, it doesn’t exist,” she said.
Gualinga belongs to the Sarayaku Indigenous group who, in 2002, sued the state of Ecuador at the Inter-American Court of Human Rights for giving the go-ahead to oil drilling ventures on their land without consulting them. Numerous attempts to intimidate the group were made during the litigation process — especially against Gualinga, who represented the Sarayaku in court. But in 2012, judges ruled in their favor and awarded the community .3 million (€1.1 million) in damages.
Violence against environmental activists has increased significantly in recent years, as shown in a report released by the environmental and human rights organization Global Witness in July. According to Global Witness, 212 environmentalists were murdered worldwide in 2019 — the highest number the group has recorded in a single year.
Media Coverage Provides Protection
Journalism is needed to bring such crimes to light, said Wessendorf, adding that international media have a particularly important responsibility.
“Journalists can bring the human rights violations often associated with environmental destruction to the attention of the wider public,” she said. “This, in turn, can lead to international solidarity and put pressure on governments or companies.”
Media coverage of the widespread fires in the Amazon region in 2019 and 2020, for example, brought the issue to a global audience, highlighting the destructive practice of slash-and-burn agriculture and the treatment of Indigenous peoples. This has led to support from many international campaigns.
“International solidarity is very important for the local population,” said Gualinga. “When they realize they’re no longer alone, that they’re visible and supported by others, it also helps ease their fear.”
Documenting Violence and Intimidation Across Borders
Gualinga and other media workers from Latin America discussed the role of journalism in the fight for environmental protection and human rights during a a recent panel discussionat DW’s Global Media Forum. Also taking part was Andres Bermudez Lievano, a Colombian journalist and one of the editors of Tierra de Resistentes (“Land of Resistants”). The investigative data journalism project, available in English, Spanish and Portuguese, was launched by Colombian Journalists’ Association, Consejo de Redaccion, with the support of the DW Akademie.
In the project, journalists from 10 different countries documented the fates of hundreds of environmental activists in Latin America who have been threatened and killed for their work. Nearly 2,400 cases have been compiled to date, with some now taken up by UN organizations.
GMF digital session: Tierra de Resistentes – Defending the planetPosted by DW Global Media Forum on Wednesday, November 11, 2020
“It was only with this transnational project that we were able to realize how big the problem of violence and intimidation really is, and that ethnic minorities are particularly affected,” said Lievano.
What also became clear was how little authorities were doing to address the problem. Of all the documented cases, only 12% made it to court — and just 10 victims saw justice. Bermudez highlighted a particularly shocking detail: in more than half of the cases, authorities were informed ahead of time of planned efforts to silence environmentalists.
Protecting sources, therefore, is a top priority for the Tierra de Resistentes project, and the reporters are very careful in their work. “In certain regions, we report back to the editorial office every hour, so that everyone knows where we are and whether everything is okay,” said Bermudez. “We announce our route ahead of time, detail who we’re meeting with and if anything has changed.”
Using international associations, networks and public visibility, journalists can continue to report on environmental efforts. Without them, warns Reporters Without Borders, these stories will go untold — and the environmental destruction will continue.
This article has been adapted from German.
Reposted with permission from Deutsche Welle.
- Amazon Threatens to Fire Employees Who Speak out on Climate ...
- Melting Glacier Study Could Hold Climate Polluters Accountable - EcoWatch