
By Nikki Yeager
Essential oils have enjoyed a boom in sales over the last decade as Western consumers search for alternatives to chemical-laden products that are toxic both to their bodies and to the planet. Since the first recorded essential oil blend was recorded in Egypt in 1,500 BC, people around the world have been using essential oils for their perceived medicinal properties. A market research study by Grand View Research estimates that the global essential oils market is expected to reach $11.67 billion by 2022. Such a high level of demand raises two vital questions: Where are all these essential oils coming from, and what is their impact on the environment?
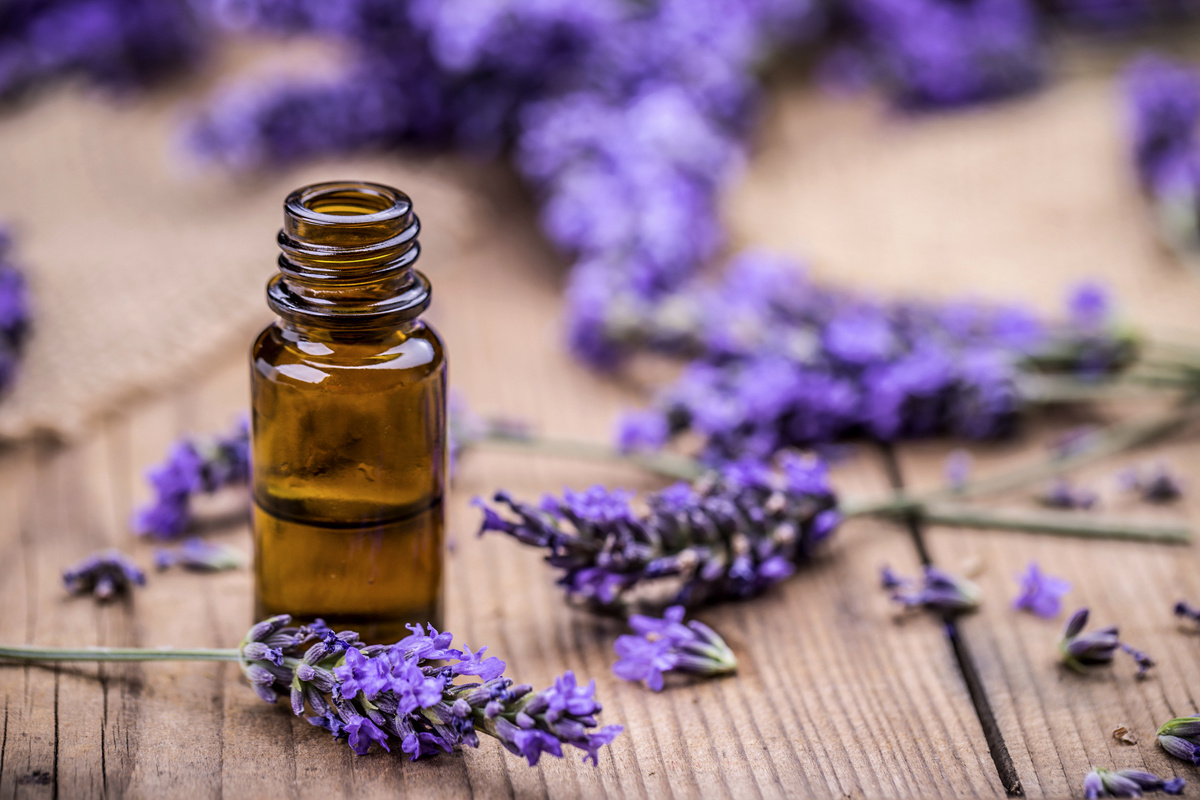
To begin with, in order to produce a single pound of essential oil, enormous quantities of plants are required: 10,000 pounds of rose petals, 250 pounds of lavender, 6,000 pounds of melissa plant, 1,500 lemons and so forth. According to Nicole Nelson, marketing coordinator for herbal distribution retailer Mountain Rose Herbs, due to a variety of factors, large amounts of produce are needed to produce oils. For example, some oils are more difficult to extract because instead of being externally secreted by the plant, the oils are stored in tiny cavities or ducts within the plant. Other oils provide small yields in general. For example, Bay Leaf can be expected to provide a 3 percent yield during distillation, whereas Rose Petals typically provide only a .006 percent yield. "Weather can also greatly affect the amount of oil that a plant produces from year to year," Nelson added.
In light of this, it's important to understand how plants for these resource-intensive products are farmed. The majority of popular essential-oils companies source their raw materials from corporate farms that turn out large quantities of plants. As with the cultivation of products on many large farms, pesticide usage is common. And there are currently no organic certifications specifically for essential oils, which large companies like YoungLiving and DoTerra cite as a reason for foregoing organic certification all together. In the end, consumers are left largely on their own when it comes to discovering which pesticides are used on crops that are used for essential oils—especially since most companies aren't voluntarily giving up that information.
One solution to large, corporate farming is wild harvesting, but this too has its downsides—some plants used for essential oils are listed on the International Union for Conservation of Nature Red List of Threatened Species, including sandalwood (Santalum album), which is listed as vulnerable, and rosewood (Aniba rosaeodora), atlas cedarwood (Cedrus atlantica), and rosewood (Dalbergia abrahamii), which are all listed as endangered. The commonly accepted rule by harvesting communities, including guidelines set by the Living Earth School of Herbalism and the San Juan National Forest Service, is that no more than 10 percent of any wild crop should be removed during a single harvesting session. Audits on wild harvesters can be done independently with a witness to the harvest, or by a third party company like Quality Certification Services to ensure wild harvests are done ethically. Still, overharvesting continues due in large part to a lack of information and regulation. And as plants become hard to find, prices rise, and in some cases, oils are adulterated to meet demand. Sandalwood, for example, has become one of the hardest to find essential oils. It also the most adulterated oil on the market.
However, there is good news to be had. It is possible to produce organic and/or pesticide- and herbicide-free oils, as well as wild harvested oils that do not damage plant species' survival. Companies like Mountain Rose Herbs provide oils that are certified "organic" by Oregon Tilth whenever possible, as well as oils that are wild harvested according to ethical harvesting guidelines.
Consumers can also check to see if a particular plant species is native to the land it's grown on. Native species typically grow with less intervention, because they are suited to the amount of rainfall, the type of soil, and the climate they are grown in. Non-native plants may need artificial climate control, chemical soil preparation and/or additional water due to the foreign environment they're being grown in.
Aside from the environmental impacts associated with producing essential oils, essential oils themselves can have an impact. Each pure oil comes with its own set of potential ecological and disposal issues. Each essential oil should have a Material Safety Data Sheet (MSDS) that provides toxicity information, flammability warnings and disposal directions. While this information is required of all essential oils in the U.S., many essential-oils companies, such as Young Living, DoTerra and Mountain Rose Oils, require consumers to contact the company directly to request MSDS information. By comparison, in the UK most MSDS information is posted directly on the company's website.
Most essential oils are extremely flammable—particularly tea tree, clove, frankincense, eucalyptus, lavender, lemon and peppermint—requiring extra precautions when disposing of them or cleaning up a spill. Flammable oils are considered household hazardous waste in small quantities, and the containers holding those items cannot be recycled unless the oil is washed from the container. Some cities require that containers of flammable liquids be thrown in the trash rather than recycled, as even trace amounts of flammable liquid can pose a danger to recycling plant workers.
That being said, removing essential oils from a previously used container must be done carefully. Many oils—including the same ones listed above as flammable—are toxic to aquatic life, and can have long-lasting impacts on marine ecosystems according to their MSDS sheets. Most also come with a warning that the oils themselves should not come in contact with a water supply or groundwater, meaning they should never be dumped down the drain or toilet.
So how should essential oils be cleaned from a container, or disposed of, in case of expiration or contamination? If a bottle of oil has expired and is no longer good for therapeutic use, the best options for disposing of the remaining oil is to use it with a passive diffuser (a porous, nonflammable material that can soak up the oil and allow the scent to linger over a period of time) or to add it to homemade cleaning products for the scent alone.
If an oil is contaminated or rancid and cannot be used, it must be disposed of through a hazardous-waste collection service. Most cities offer hazardous household waste programs, which can be found through local waste-management programs. For large or bulk quantities of essential oils and carrier oils (oils like Jojoba and Sweet Almond oil that are used to dilute essential oils in oil blends), biodiesel salvage companies like SeQuentialPacific Biodiesel will accept oils for biodiesel production so the waste ends up being used productively.
Container recycling can also pose challenges. All quality essential-oils products come in glass containers, since pure essential oils can degrade plastic. Glass bottles can be recycled in most cities, though some cities, such as New York, require all glass that previously held flammable or hazardous materials be thrown in the regular trash. With 106 kilotons of essential oils produced in 2014 alone, that's a lot of glass bottles potentially ending up in the trash! Essential oils sold to consumers come with a plastic lid and either a rollerball or drop-dispenser—due to recycling constraints, these typically end up in landfills as well.
So how can essential oil aficionados best reduce their waste? Some companies allow customers to return bottles for recycling. If that service isn't available, the best way to recycle essential-oils packaging would be to dispose of the oils following the recommendations of your local waste-management company.
Essential oils are here to stay and can be a more natural solution to common discomforts and ailments than traditional chemical and pharmaceutical cures. However, it's the responsibility of consumers to question companies on farming practices and to commit to proper disposal and recycling habits. Without consumers taking the extra steps to vet their essential-oils companies, it's easy for this resource-intensive industry to fall into harmful ecological practices.
A rare yellow penguin has been photographed for what is believed to be the first time.
- World-Renowned Photographer Documents Most Remote ... ›
- This Penguin Colony Has Fallen by 77% on Antarctic Islands ... ›
EcoWatch Daily Newsletter
By Stuart Braun
We spend 90% of our time in the buildings where we live and work, shop and conduct business, in the structures that keep us warm in winter and cool in summer.
But immense energy is required to source and manufacture building materials, to power construction sites, to maintain and renew the built environment. In 2019, building operations and construction activities together accounted for 38% of global energy-related CO2 emissions, the highest level ever recorded.
- Could IKEA's New Tiny House Help Fight the Climate Crisis ... ›
- Los Angeles City-Owned Buildings to Go 100% Carbon Free ... ›
- New Jersey Will Be First State to Require Building Permits to ... ›
Trending
By Eric Tate and Christopher Emrich
Disasters stemming from hazards like floods, wildfires, and disease often garner attention because of their extreme conditions and heavy societal impacts. Although the nature of the damage may vary, major disasters are alike in that socially vulnerable populations often experience the worst repercussions. For example, we saw this following Hurricanes Katrina and Harvey, each of which generated widespread physical damage and outsized impacts to low-income and minority survivors.
Mapping Social Vulnerability
<p>Figure 1a is a typical map of social vulnerability across the United States at the census tract level based on the Social Vulnerability Index (SoVI) algorithm of <a href="https://onlinelibrary.wiley.com/doi/abs/10.1111/1540-6237.8402002" target="_blank"><em>Cutter et al.</em></a> [2003]. Spatial representation of the index depicts high social vulnerability regionally in the Southwest, upper Great Plains, eastern Oklahoma, southern Texas, and southern Appalachia, among other places. With such a map, users can focus attention on select places and identify population characteristics associated with elevated vulnerabilities.</p>Fig. 1. (a) Social vulnerability across the United States at the census tract scale is mapped here following the Social Vulnerability Index (SoVI). Red and pink hues indicate high social vulnerability. (b) This bivariate map depicts social vulnerability (blue hues) and annualized per capita hazard losses (pink hues) for U.S. counties from 2010 to 2019.
<p>Many current indexes in the United States and abroad are direct or conceptual offshoots of SoVI, which has been widely replicated [e.g., <a href="https://link.springer.com/article/10.1007/s13753-016-0090-9" target="_blank"><em>de Loyola Hummell et al.</em></a>, 2016]. The U.S. Centers for Disease Control and Prevention (CDC) <a href="https://www.atsdr.cdc.gov/placeandhealth/svi/index.html" target="_blank">has also developed</a> a commonly used social vulnerability index intended to help local officials identify communities that may need support before, during, and after disasters.</p><p>The first modeling and mapping efforts, starting around the mid-2000s, largely focused on describing spatial distributions of social vulnerability at varying geographic scales. Over time, research in this area came to emphasize spatial comparisons between social vulnerability and physical hazards [<a href="https://doi.org/10.1007/s11069-009-9376-1" target="_blank"><em>Wood et al.</em></a>, 2010], modeling population dynamics following disasters [<a href="https://link.springer.com/article/10.1007%2Fs11111-008-0072-y" target="_blank" rel="noopener noreferrer"><em>Myers et al.</em></a>, 2008], and quantifying the robustness of social vulnerability measures [<a href="https://doi.org/10.1007/s11069-012-0152-2" target="_blank" rel="noopener noreferrer"><em>Tate</em></a>, 2012].</p><p>More recent work is beginning to dissolve barriers between social vulnerability and environmental justice scholarship [<a href="https://doi.org/10.2105/AJPH.2018.304846" target="_blank" rel="noopener noreferrer"><em>Chakraborty et al.</em></a>, 2019], which has traditionally focused on root causes of exposure to pollution hazards. Another prominent new research direction involves deeper interrogation of social vulnerability drivers in specific hazard contexts and disaster phases (e.g., before, during, after). Such work has revealed that interactions among drivers are important, but existing case studies are ill suited to guiding development of new indicators [<a href="https://doi.org/10.1016/j.ijdrr.2015.09.013" target="_blank" rel="noopener noreferrer"><em>Rufat et al.</em></a>, 2015].</p><p>Advances in geostatistical analyses have enabled researchers to characterize interactions more accurately among social vulnerability and hazard outcomes. Figure 1b depicts social vulnerability and annualized per capita hazard losses for U.S. counties from 2010 to 2019, facilitating visualization of the spatial coincidence of pre‑event susceptibilities and hazard impacts. Places ranked high in both dimensions may be priority locations for management interventions. Further, such analysis provides invaluable comparisons between places as well as information summarizing state and regional conditions.</p><p>In Figure 2, we take the analysis of interactions a step further, dividing counties into two categories: those experiencing annual per capita losses above or below the national average from 2010 to 2019. The differences among individual race, ethnicity, and poverty variables between the two county groups are small. But expressing race together with poverty (poverty attenuated by race) produces quite different results: Counties with high hazard losses have higher percentages of both impoverished Black populations and impoverished white populations than counties with low hazard losses. These county differences are most pronounced for impoverished Black populations.</p>Fig. 2. Differences in population percentages between counties experiencing annual per capita losses above or below the national average from 2010 to 2019 for individual and compound social vulnerability indicators (race and poverty).
<p>Our current work focuses on social vulnerability to floods using geostatistical modeling and mapping. The research directions are twofold. The first is to develop hazard-specific indicators of social vulnerability to aid in mitigation planning [<a href="https://doi.org/10.1007/s11069-020-04470-2" target="_blank" rel="noopener noreferrer"><em>Tate et al.</em></a>, 2021]. Because natural hazards differ in their innate characteristics (e.g., rate of onset, spatial extent), causal processes (e.g., urbanization, meteorology), and programmatic responses by government, manifestations of social vulnerability vary across hazards.</p><p>The second is to assess the degree to which socially vulnerable populations benefit from the leading disaster recovery programs [<a href="https://doi.org/10.1080/17477891.2019.1675578" target="_blank" rel="noopener noreferrer"><em>Emrich et al.</em></a>, 2020], such as the Federal Emergency Management Agency's (FEMA) <a href="https://www.fema.gov/individual-disaster-assistance" target="_blank" rel="noopener noreferrer">Individual Assistance</a> program and the U.S. Department of Housing and Urban Development's Community Development Block Grant (CDBG) <a href="https://www.hudexchange.info/programs/cdbg-dr/" target="_blank" rel="noopener noreferrer">Disaster Recovery</a> program. Both research directions posit social vulnerability indicators as potential measures of social equity.</p>Social Vulnerability as a Measure of Equity
<p>Given their focus on social marginalization and economic barriers, social vulnerability indicators are attracting growing scientific interest as measures of inequity resulting from disasters. Indeed, social vulnerability and inequity are related concepts. Social vulnerability research explores the differential susceptibilities and capacities of disaster-affected populations, whereas social equity analyses tend to focus on population disparities in the allocation of resources for hazard mitigation and disaster recovery. Interventions with an equity focus emphasize full and equal resource access for all people with unmet disaster needs.</p><p>Yet newer studies of inequity in disaster programs have documented troubling disparities in income, race, and home ownership among those who <a href="https://eos.org/articles/equity-concerns-raised-in-federal-flood-property-buyouts" target="_blank">participate in flood buyout programs</a>, are <a href="https://www.eenews.net/stories/1063477407" target="_blank" rel="noopener noreferrer">eligible for postdisaster loans</a>, receive short-term recovery assistance [<a href="https://doi.org/10.1016/j.ijdrr.2020.102010" target="_blank" rel="noopener noreferrer"><em>Drakes et al.</em></a>, 2021], and have <a href="https://www.texastribune.org/2020/08/25/texas-natural-disasters--mental-health/" target="_blank" rel="noopener noreferrer">access to mental health services</a>. For example, a recent analysis of federal flood buyouts found racial privilege to be infused at multiple program stages and geographic scales, resulting in resources that disproportionately benefit whiter and more urban counties and neighborhoods [<a href="https://doi.org/10.1177/2378023120905439" target="_blank" rel="noopener noreferrer"><em>Elliott et al.</em></a>, 2020].</p><p>Investments in disaster risk reduction are largely prioritized on the basis of hazard modeling, historical impacts, and economic risk. Social equity, meanwhile, has been far less integrated into the considerations of public agencies for hazard and disaster management. But this situation may be beginning to shift. Following the adage of "what gets measured gets managed," social equity metrics are increasingly being inserted into disaster management.</p><p>At the national level, FEMA has <a href="https://www.fema.gov/news-release/20200220/fema-releases-affordability-framework-national-flood-insurance-program" target="_blank">developed options</a> to increase the affordability of flood insurance [Federal Emergency Management Agency, 2018]. At the subnational scale, Puerto Rico has integrated social vulnerability into its CDBG Mitigation Action Plan, expanding its considerations of risk beyond only economic factors. At the local level, Harris County, Texas, has begun using social vulnerability indicators alongside traditional measures of flood risk to introduce equity into the prioritization of flood mitigation projects [<a href="https://www.hcfcd.org/Portals/62/Resilience/Bond-Program/Prioritization-Framework/final_prioritization-framework-report_20190827.pdf?ver=2019-09-19-092535-743" target="_blank" rel="noopener noreferrer"><em>Harris County Flood Control District</em></a>, 2019].</p><p>Unfortunately, many existing measures of disaster equity fall short. They may be unidimensional, using single indicators such as income in places where underlying vulnerability processes suggest that a multidimensional measure like racialized poverty (Figure 2) would be more valid. And criteria presumed to be objective and neutral for determining resource allocation, such as economic loss and cost-benefit ratios, prioritize asset value over social equity. For example, following the <a href="http://www.cedar-rapids.org/discover_cedar_rapids/flood_of_2008/2008_flood_facts.php" target="_blank" rel="noopener noreferrer">2008 flooding</a> in Cedar Rapids, Iowa, cost-benefit criteria supported new flood protections for the city's central business district on the east side of the Cedar River but not for vulnerable populations and workforce housing on the west side.</p><p>Furthermore, many equity measures are aspatial or ahistorical, even though the roots of marginalization may lie in systemic and spatially explicit processes that originated long ago like redlining and urban renewal. More research is thus needed to understand which measures are most suitable for which social equity analyses.</p>Challenges for Disaster Equity Analysis
<p>Across studies that quantify, map, and analyze social vulnerability to natural hazards, modelers have faced recurrent measurement challenges, many of which also apply in measuring disaster equity (Table 1). The first is clearly establishing the purpose of an equity analysis by defining characteristics such as the end user and intended use, the type of hazard, and the disaster stage (i.e., mitigation, response, or recovery). Analyses using generalized indicators like the CDC Social Vulnerability Index may be appropriate for identifying broad areas of concern, whereas more detailed analyses are ideal for high-stakes decisions about budget allocations and project prioritization.</p>Wisconsin will end its controversial wolf hunt early after hunters and trappers killed almost 70 percent of the state's quota in the hunt's first 48 hours.
By Jessica Corbett
Sen. Bernie Sanders on Tuesday was the lone progressive to vote against Tom Vilsack reprising his role as secretary of agriculture, citing concerns that progressive advocacy groups have been raising since even before President Joe Biden officially nominated the former Obama administration appointee.