
By Susan Cosier
First there was Fred Stone, the third-generation dairy farmer in Maine who discovered that the milk from his cows contained harmful chemicals. Then came Art Schaap, a second-generation dairy farmer in New Mexico, who had to dump 15,000 gallons of contaminated milk a day.
While the pollutants in these cases were different, they both belong to the same class of chemicals: per- and polyfluoroalkyl substances, or PFAS for short. Numbering in the thousands, the chemicals are used to make a variety of products such as nonstick pans, stain-resistant rugs, water-repellent clothing and food packaging. Industries have been manufacturing most PFAS since the 1940s, but the effects these chemicals have on human health started surfacing only in the past decade or so. Exposure has been linked to serious conditions, including testicular and kidney cancer, colitis, thyroid disorders and suppressed immune systems in children.
Many states are just beginning to look for PFAS contamination in drinking water and elsewhere, and places like Michigan, where state officials are actively testing for (and finding) these chemicals, are starting to look like contamination hot spots. In reality, the PFAS problem is much more widespread.
While Teflon plants and military bases that use firefighting foams are common PFAS sources, another culprit is emerging: sludge produced by sewage treatment plants. Farmers all over the country use such sludge to fertilize their land, potentially contaminating the crops and livestock they produce. And it could be happening in the Midwest, too.
Wary in Wisconsin
Doug Oitzinger, the former mayor of Marinette, Wisconsin, was at a meeting to discuss a new community garden last year when he found out about his town's groundwater. Just 30 feet below where they stood, levels of PFAS were as high as 33,000 parts per trillion (ppt), more than 470 times the U.S. Environmental Protection Agency's health advisory level for drinking water of 70 ppt — a concentration many experts and states still consider a threat to human health. A few months later, Oitzinger knocked on a neighbor's door to see if anyone had told her about the pollution pooling below her home. She said she hadn't heard a thing.
In the beginning, he thought the contamination was limited to a specific area at the edge of town, close to the Tyco Fire Technology Center run by Johnson Controls International. But the more Oitzinger researched, the more concerned, and angry, he became. He's now pushing for Wisconsin politicians to make the PFAS issue a top priority. "I went from somebody who thought this was an unfortunate thing Tyco didn't know about, to ... well, let's just say their hands are covered in some pretty nasty stuff," he said.
Tyco knew back in 2013 of its PFAS problem, according to records it submitted to the Wisconsin Department of Natural Resources (DNR), but it wasn't until 2016 that the company documented the chemicals on its property and in the groundwater nearby. The public found out about it only in 2017, four years after Tyco's original admission, when the company acknowledged to the DNR that its pollution could be spreading.
When Tyco disclosed that PFAS pollution had contaminated groundwater in Marinette and nearby Peshtigo, the DNR directed the company to find affected wells. Since December 2017, Tyco has been voluntarily distributing bottled water to more than 120 households and installed 37 water treatment systems in the community. But it's not enough, and drinking water isn't the only thing in jeopardy. Just like other PFAS manufacturers, Tyco sent its waste to a local sewage treatment plant, where farmers obtain sludge for fertilizing their fields.
"We foolishly thought that we had institutions that would protect us from this sort of thing, that this couldn't happen anymore," said Oitzinger. "What we've discovered is that those institutions didn't protect us."
The DNR has since asked the wastewater treatment facility to stop selling sludge to farmers and launched a larger investigation into the matter earlier this year. For many farm owners, however, this action may have come too late — and there are no quick fixes. PFAS do not easily break down and can persist in the environment for decades, if not centuries.
A Message From Maine
The Stone family had been raising dairy cows in southern Maine for close to a century when, in 2016, Fred Stone voluntarily checked the farm's milk for PFAS. What he found, he said, destroyed his life: levels as high as 1,470 ppt.
"The toxic chemicals that I never used and had never even known about until two years ago contaminated my cows — which I really take exception to — and ruined my farming operation and hurt my family," he told reporters at a March press conference.
Stone had spread PFAS-contaminated sludge and paper mill ash on his fields for 20 years, but he stopped that practice in 2004. After 15 years, the substances were still there in amounts that could severely taint the milk of Stoneridge Farm, which is now out of business.
Stone went to Washington, DC, to ask Congress do something about PFAS contamination. Back in Maine, legislators set a PFOS action level of 210 ppt in milk, and the governor set up a PFAS task force. Maine's Department of Environmental Protection (DEP) temporarily stopped allowing farmers to spread sludge on their fields until it was tested. In 44 sludge samples taken by the agency, all but two had levels that exceeded the state's new limits for three PFAS chemicals: PFOA (2.5 parts per billion), PFOS (5.2 ppb), and PFBS (1,900 ppb). The DEP also tested retail and raw milk from three other farms, where PFAS levels did not exceed the state's reporting limit of 50 ppt.
So far, Stone's is the only Maine farm to shutter due to PFAS contamination, but others could follow and clean fields are still at risk. The Maine-based nonprofit Environmental Health Strategy Center has been pushing for the state to investigate other farms that received sludge from the same place as Stone, said Patrick MacRoy, deputy director of the group, but the group hasn't yet gotten a list of such farms, and testing isn't mandatory.
Beyond Milk
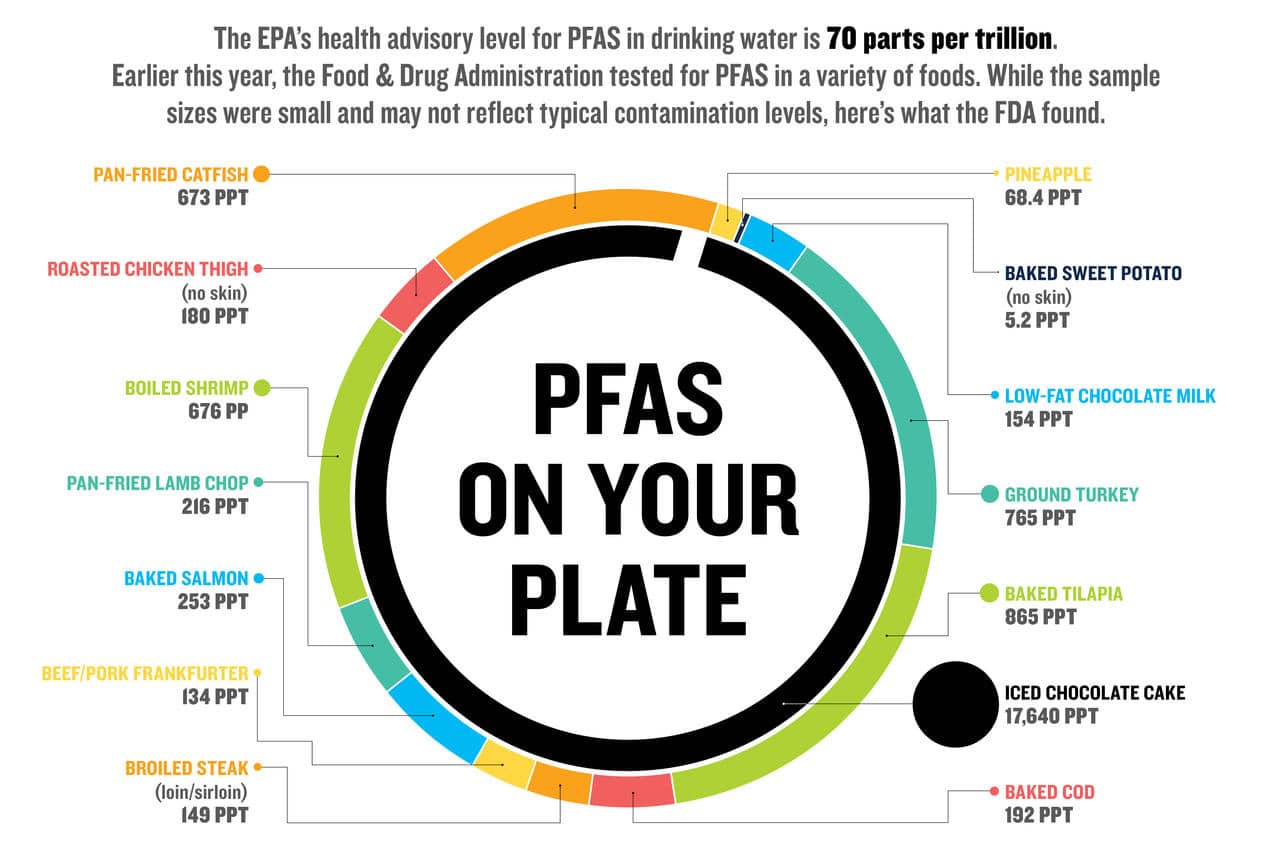
Even though no federal PFAS standards exist, lawmakers in a few states such as Vermont, Michigan and New Hampshire have proposed or passed bills that limit various types of PFAS — at differing concentrations — in drinking water. For Wisconsin's water supplies, the state's Department of Health Services recently recommended limits for PFOA and PFOS, two of the most widely used types, at 20 ppt. These are moves in the right direction, but PFAS find their way into more than just water. Researchers have been detecting these substances in everything from fish to leafy greens and grains to iced chocolate cake.
According to a 2012 study conducted by the Center for Food Safety and Applied Nutrition, a branch of the U.S. Food and Drug Administration, "a number of researchers have concluded that food is often the primary human exposure route" for PFAS. (A 2016 EPA report agreed that diet is a primary source.)
Milk containing PFAS tends to be particularly potent because the substances bioaccumulate in cows. Farmers spread sludge on fields, plants take the contaminants up from the soil, then cows eat the grass in great amounts, concentrating the PFAS, which end up in their milk. That's bad for children, who tend to drink lots of milk and are also more vulnerable to these substances than adults are.
"Yes, exposure from milk is likely less than drinking water for adults, but for infants and children it's different," said Anna Reade, an NRDC staff scientist specializing in toxic chemicals. "It could be a significant source of exposure, and they're the most vulnerable in our population. We have a responsibility to protect them." Yet so far, no state except Maine has begun to develop a PFAS standard for milk — or any other food, for that matter.
The 2012 study showed that PFAS levels in 49 milk samples taken from around the country didn't contain levels higher than the EPA health advisory level of 70 ppt except for one — taken from a dairy farm where sludge was spread. Locations where we know farmers spread contaminated sludge are good places to be testing, said Erik Olson, NRDC's director of health and food.
In Wisconsin, the DNR has a map of where the state's farmers have spread biosolids from the wastewater treatment facility used by Tyco, and staff have tested the farms' soils and their surface water and groundwater. The results are expected this fall, but the agency hasn't yet indicated whether it will also test the foods grown on these farms.
Needless to say, tensions are high in these parts. "This is like coming to someone and saying your house is radioactive," said Oitzinger.
NRDC's Reade suggests that state agencies test sludge before it's spread on fields and milk before it goes to market. Then officials could see where the highest PFAS concentrations are coming from. But she knows that's not a popular idea. "PFAS is a huge, global public health threat," she said. "It's going to be hard to test for all this."
In July, the Wisconsin DNR urged 125 sewage treatment plants to test their waste products, but the agency has yet to set a PFAS standard for sludge or milk. Oitzinger hopes to change that. He's now working with a small group of activists and Wisconsin lawmakers to put PFAS standards on the books in his state, but he fears for the rest of the country, too.
The problems with these chemicals are complex, he said, and as Stone knows, they don't go away on their own. "It's like peeling an onion," he said. "Every time you take a layer off, there's another layer, and the more layers you take off, the more your eyes water. It just gets worse and worse."
Termed "forever #chemicals," PFAS can take thousands of years to break down in the environment and can remain in our bodies for decades https://t.co/Ult9ScqiCw @ewg
— EcoWatch (@EcoWatch) September 27, 2019
- What Are 'Forever Chemicals' and How Are They Getting in Your ... ›
- PFAS Chemicals Contaminate U.S. Food Supply, FDA Confirms ... ›
A rare yellow penguin has been photographed for what is believed to be the first time.
- World-Renowned Photographer Documents Most Remote ... ›
- This Penguin Colony Has Fallen by 77% on Antarctic Islands ... ›
EcoWatch Daily Newsletter
By Stuart Braun
We spend 90% of our time in the buildings where we live and work, shop and conduct business, in the structures that keep us warm in winter and cool in summer.
But immense energy is required to source and manufacture building materials, to power construction sites, to maintain and renew the built environment. In 2019, building operations and construction activities together accounted for 38% of global energy-related CO2 emissions, the highest level ever recorded.
- Could IKEA's New Tiny House Help Fight the Climate Crisis ... ›
- Los Angeles City-Owned Buildings to Go 100% Carbon Free ... ›
- New Jersey Will Be First State to Require Building Permits to ... ›
Trending
By Eric Tate and Christopher Emrich
Disasters stemming from hazards like floods, wildfires, and disease often garner attention because of their extreme conditions and heavy societal impacts. Although the nature of the damage may vary, major disasters are alike in that socially vulnerable populations often experience the worst repercussions. For example, we saw this following Hurricanes Katrina and Harvey, each of which generated widespread physical damage and outsized impacts to low-income and minority survivors.
Mapping Social Vulnerability
<p>Figure 1a is a typical map of social vulnerability across the United States at the census tract level based on the Social Vulnerability Index (SoVI) algorithm of <a href="https://onlinelibrary.wiley.com/doi/abs/10.1111/1540-6237.8402002" target="_blank"><em>Cutter et al.</em></a> [2003]. Spatial representation of the index depicts high social vulnerability regionally in the Southwest, upper Great Plains, eastern Oklahoma, southern Texas, and southern Appalachia, among other places. With such a map, users can focus attention on select places and identify population characteristics associated with elevated vulnerabilities.</p>Fig. 1. (a) Social vulnerability across the United States at the census tract scale is mapped here following the Social Vulnerability Index (SoVI). Red and pink hues indicate high social vulnerability. (b) This bivariate map depicts social vulnerability (blue hues) and annualized per capita hazard losses (pink hues) for U.S. counties from 2010 to 2019.
<p>Many current indexes in the United States and abroad are direct or conceptual offshoots of SoVI, which has been widely replicated [e.g., <a href="https://link.springer.com/article/10.1007/s13753-016-0090-9" target="_blank"><em>de Loyola Hummell et al.</em></a>, 2016]. The U.S. Centers for Disease Control and Prevention (CDC) <a href="https://www.atsdr.cdc.gov/placeandhealth/svi/index.html" target="_blank">has also developed</a> a commonly used social vulnerability index intended to help local officials identify communities that may need support before, during, and after disasters.</p><p>The first modeling and mapping efforts, starting around the mid-2000s, largely focused on describing spatial distributions of social vulnerability at varying geographic scales. Over time, research in this area came to emphasize spatial comparisons between social vulnerability and physical hazards [<a href="https://doi.org/10.1007/s11069-009-9376-1" target="_blank"><em>Wood et al.</em></a>, 2010], modeling population dynamics following disasters [<a href="https://link.springer.com/article/10.1007%2Fs11111-008-0072-y" target="_blank" rel="noopener noreferrer"><em>Myers et al.</em></a>, 2008], and quantifying the robustness of social vulnerability measures [<a href="https://doi.org/10.1007/s11069-012-0152-2" target="_blank" rel="noopener noreferrer"><em>Tate</em></a>, 2012].</p><p>More recent work is beginning to dissolve barriers between social vulnerability and environmental justice scholarship [<a href="https://doi.org/10.2105/AJPH.2018.304846" target="_blank" rel="noopener noreferrer"><em>Chakraborty et al.</em></a>, 2019], which has traditionally focused on root causes of exposure to pollution hazards. Another prominent new research direction involves deeper interrogation of social vulnerability drivers in specific hazard contexts and disaster phases (e.g., before, during, after). Such work has revealed that interactions among drivers are important, but existing case studies are ill suited to guiding development of new indicators [<a href="https://doi.org/10.1016/j.ijdrr.2015.09.013" target="_blank" rel="noopener noreferrer"><em>Rufat et al.</em></a>, 2015].</p><p>Advances in geostatistical analyses have enabled researchers to characterize interactions more accurately among social vulnerability and hazard outcomes. Figure 1b depicts social vulnerability and annualized per capita hazard losses for U.S. counties from 2010 to 2019, facilitating visualization of the spatial coincidence of pre‑event susceptibilities and hazard impacts. Places ranked high in both dimensions may be priority locations for management interventions. Further, such analysis provides invaluable comparisons between places as well as information summarizing state and regional conditions.</p><p>In Figure 2, we take the analysis of interactions a step further, dividing counties into two categories: those experiencing annual per capita losses above or below the national average from 2010 to 2019. The differences among individual race, ethnicity, and poverty variables between the two county groups are small. But expressing race together with poverty (poverty attenuated by race) produces quite different results: Counties with high hazard losses have higher percentages of both impoverished Black populations and impoverished white populations than counties with low hazard losses. These county differences are most pronounced for impoverished Black populations.</p>Fig. 2. Differences in population percentages between counties experiencing annual per capita losses above or below the national average from 2010 to 2019 for individual and compound social vulnerability indicators (race and poverty).
<p>Our current work focuses on social vulnerability to floods using geostatistical modeling and mapping. The research directions are twofold. The first is to develop hazard-specific indicators of social vulnerability to aid in mitigation planning [<a href="https://doi.org/10.1007/s11069-020-04470-2" target="_blank" rel="noopener noreferrer"><em>Tate et al.</em></a>, 2021]. Because natural hazards differ in their innate characteristics (e.g., rate of onset, spatial extent), causal processes (e.g., urbanization, meteorology), and programmatic responses by government, manifestations of social vulnerability vary across hazards.</p><p>The second is to assess the degree to which socially vulnerable populations benefit from the leading disaster recovery programs [<a href="https://doi.org/10.1080/17477891.2019.1675578" target="_blank" rel="noopener noreferrer"><em>Emrich et al.</em></a>, 2020], such as the Federal Emergency Management Agency's (FEMA) <a href="https://www.fema.gov/individual-disaster-assistance" target="_blank" rel="noopener noreferrer">Individual Assistance</a> program and the U.S. Department of Housing and Urban Development's Community Development Block Grant (CDBG) <a href="https://www.hudexchange.info/programs/cdbg-dr/" target="_blank" rel="noopener noreferrer">Disaster Recovery</a> program. Both research directions posit social vulnerability indicators as potential measures of social equity.</p>Social Vulnerability as a Measure of Equity
<p>Given their focus on social marginalization and economic barriers, social vulnerability indicators are attracting growing scientific interest as measures of inequity resulting from disasters. Indeed, social vulnerability and inequity are related concepts. Social vulnerability research explores the differential susceptibilities and capacities of disaster-affected populations, whereas social equity analyses tend to focus on population disparities in the allocation of resources for hazard mitigation and disaster recovery. Interventions with an equity focus emphasize full and equal resource access for all people with unmet disaster needs.</p><p>Yet newer studies of inequity in disaster programs have documented troubling disparities in income, race, and home ownership among those who <a href="https://eos.org/articles/equity-concerns-raised-in-federal-flood-property-buyouts" target="_blank">participate in flood buyout programs</a>, are <a href="https://www.eenews.net/stories/1063477407" target="_blank" rel="noopener noreferrer">eligible for postdisaster loans</a>, receive short-term recovery assistance [<a href="https://doi.org/10.1016/j.ijdrr.2020.102010" target="_blank" rel="noopener noreferrer"><em>Drakes et al.</em></a>, 2021], and have <a href="https://www.texastribune.org/2020/08/25/texas-natural-disasters--mental-health/" target="_blank" rel="noopener noreferrer">access to mental health services</a>. For example, a recent analysis of federal flood buyouts found racial privilege to be infused at multiple program stages and geographic scales, resulting in resources that disproportionately benefit whiter and more urban counties and neighborhoods [<a href="https://doi.org/10.1177/2378023120905439" target="_blank" rel="noopener noreferrer"><em>Elliott et al.</em></a>, 2020].</p><p>Investments in disaster risk reduction are largely prioritized on the basis of hazard modeling, historical impacts, and economic risk. Social equity, meanwhile, has been far less integrated into the considerations of public agencies for hazard and disaster management. But this situation may be beginning to shift. Following the adage of "what gets measured gets managed," social equity metrics are increasingly being inserted into disaster management.</p><p>At the national level, FEMA has <a href="https://www.fema.gov/news-release/20200220/fema-releases-affordability-framework-national-flood-insurance-program" target="_blank">developed options</a> to increase the affordability of flood insurance [Federal Emergency Management Agency, 2018]. At the subnational scale, Puerto Rico has integrated social vulnerability into its CDBG Mitigation Action Plan, expanding its considerations of risk beyond only economic factors. At the local level, Harris County, Texas, has begun using social vulnerability indicators alongside traditional measures of flood risk to introduce equity into the prioritization of flood mitigation projects [<a href="https://www.hcfcd.org/Portals/62/Resilience/Bond-Program/Prioritization-Framework/final_prioritization-framework-report_20190827.pdf?ver=2019-09-19-092535-743" target="_blank" rel="noopener noreferrer"><em>Harris County Flood Control District</em></a>, 2019].</p><p>Unfortunately, many existing measures of disaster equity fall short. They may be unidimensional, using single indicators such as income in places where underlying vulnerability processes suggest that a multidimensional measure like racialized poverty (Figure 2) would be more valid. And criteria presumed to be objective and neutral for determining resource allocation, such as economic loss and cost-benefit ratios, prioritize asset value over social equity. For example, following the <a href="http://www.cedar-rapids.org/discover_cedar_rapids/flood_of_2008/2008_flood_facts.php" target="_blank" rel="noopener noreferrer">2008 flooding</a> in Cedar Rapids, Iowa, cost-benefit criteria supported new flood protections for the city's central business district on the east side of the Cedar River but not for vulnerable populations and workforce housing on the west side.</p><p>Furthermore, many equity measures are aspatial or ahistorical, even though the roots of marginalization may lie in systemic and spatially explicit processes that originated long ago like redlining and urban renewal. More research is thus needed to understand which measures are most suitable for which social equity analyses.</p>Challenges for Disaster Equity Analysis
<p>Across studies that quantify, map, and analyze social vulnerability to natural hazards, modelers have faced recurrent measurement challenges, many of which also apply in measuring disaster equity (Table 1). The first is clearly establishing the purpose of an equity analysis by defining characteristics such as the end user and intended use, the type of hazard, and the disaster stage (i.e., mitigation, response, or recovery). Analyses using generalized indicators like the CDC Social Vulnerability Index may be appropriate for identifying broad areas of concern, whereas more detailed analyses are ideal for high-stakes decisions about budget allocations and project prioritization.</p>Wisconsin will end its controversial wolf hunt early after hunters and trappers killed almost 70 percent of the state's quota in the hunt's first 48 hours.
By Jessica Corbett
Sen. Bernie Sanders on Tuesday was the lone progressive to vote against Tom Vilsack reprising his role as secretary of agriculture, citing concerns that progressive advocacy groups have been raising since even before President Joe Biden officially nominated the former Obama administration appointee.