
 568k
568k  233k
233k  41k
41k  Subscribe
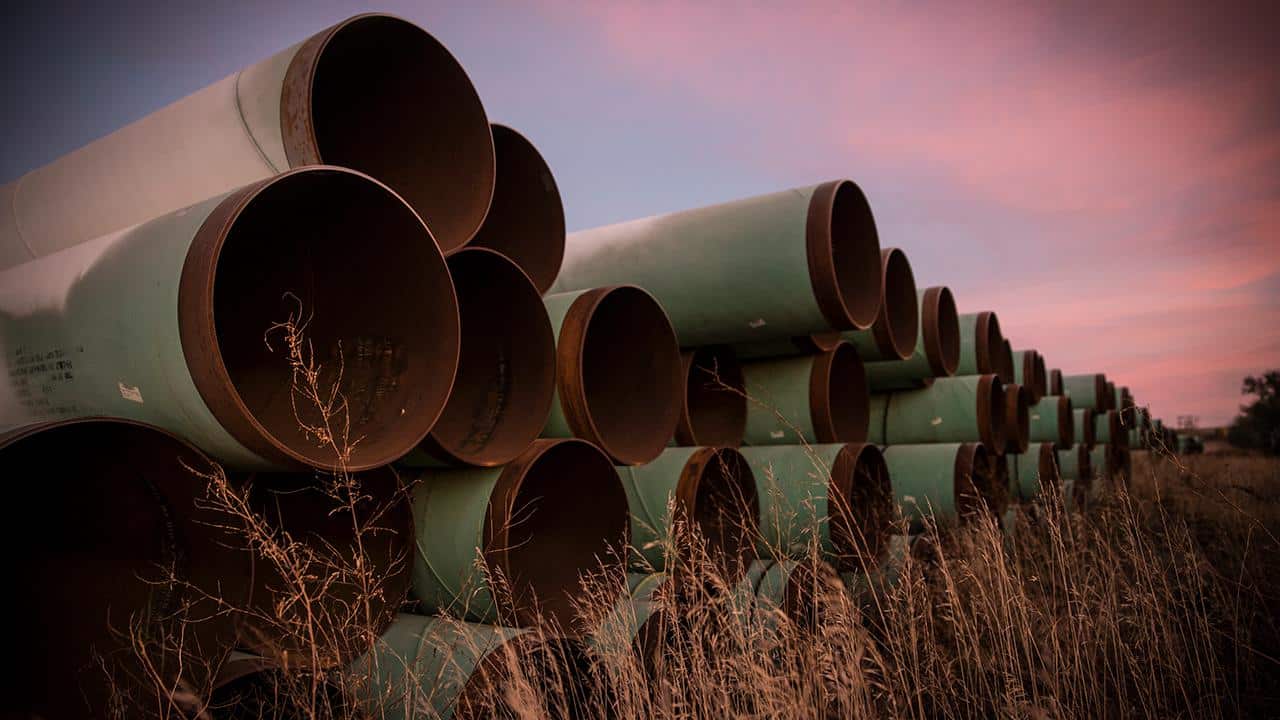
What Is the Keystone Pipeline?
The Keystone pipeline is an existing structure that carries oil from Alberta, Canada, down to Cushing, Oklahoma. The major controversy surrounds a proposed 1,200-mile extension, or shortcut, between Alberta and Nebraska. Dubbed the Keystone XL pipeline, this additional route would connect into the existing Keystone pipeline in Nebraska, which extends onward to Texas. It’s worth noting that the proposed shortcut shouldn’t be confused with an already existing Keystone XL extension between Oklahoma and Texas, called the Gulf Coast pipeline, which has been operating since 2014.
The additional extension has been under consideration since 2008, when Canadian-based TC Energy (known as TransCanada at the time) decided this would be the best way to ramp up oil production as the route would allow 830,000 barrels a day to be transported to Texas. The current pipeline carries around 550,000 barrels a day from Canada. However, the proposed shortcut faced almost immediate objections from a varied contingency concerning the pipeline’s environmental impact. For more than a decade the project has been caught in a tug of war between political administrations, environmentalists and oil lobbyists, alternating between having permits granted then revoked. The battle continues to this day.
How Much of the Keystone Pipeline Is Completed?
It’s estimated that just eight percent of the Keystone XL pipeline has been built so far, although President Joe Biden canceled the project in January 2021.
History
Understanding the fuller picture of the pipeline’s complicated history involves some patience. The pipeline first underwent environmental review by the U.S. State Department in 2009. Around this time, Nebraskans started raising concerns about the pipeline’s potential impact on farmland and a major water system. The State Department approved the pipeline moving forward in 2010 after determining it would have a minimal effect on the environment, but this only increased opposition from state legislators and scientists. As a result, the State Department delayed the project for another year pending additional review, yet came to the same conclusion in 2011.
Following increased protest activity that year surrounding environmental concerns in Nebraska, the department revised its decision and ordered the pipeline to be rerouted through the state, and TC Energy agreed. Yet this wasn’t the end. Barack Obama, president at the time, blocked the Alberta to Nebraska extension based on insufficient time for officials to properly review the new proposed route.
Meanwhile, TC Energy moved forward with the southern extension from Oklahoma to Texas in 2012 while re-submitting a new reroute application for the first leg. No sooner did Nebraska approve the new route in 2013 before opponents filed a lawsuit against the state government. In 2014 a Nebraska judge ruled in favor of the opposition, and the State Department once again suspended moving forward. After being laddered up to the Nebraska Supreme Court, the previous ruling was overturned in 2015 and the U.S. Senate greenlit Keystone XL to resume yet again. President Obama immediately vetoed the bill; later that year the administration rejected TC Energy’s reroute application, putting a supposed end to the project.
That is, until Donald Trump took office in 2016. One of President Trump’s first orders revived the Keystone XL pipeline in 2017. A federal judge blocked that order in 2018, pending an environmental review. Not to be outdone, President Trump issued a presidential permit in 2019 allowing the pipeline to proceed, and construction began in 2020.
Why Is There So Much Opposition?
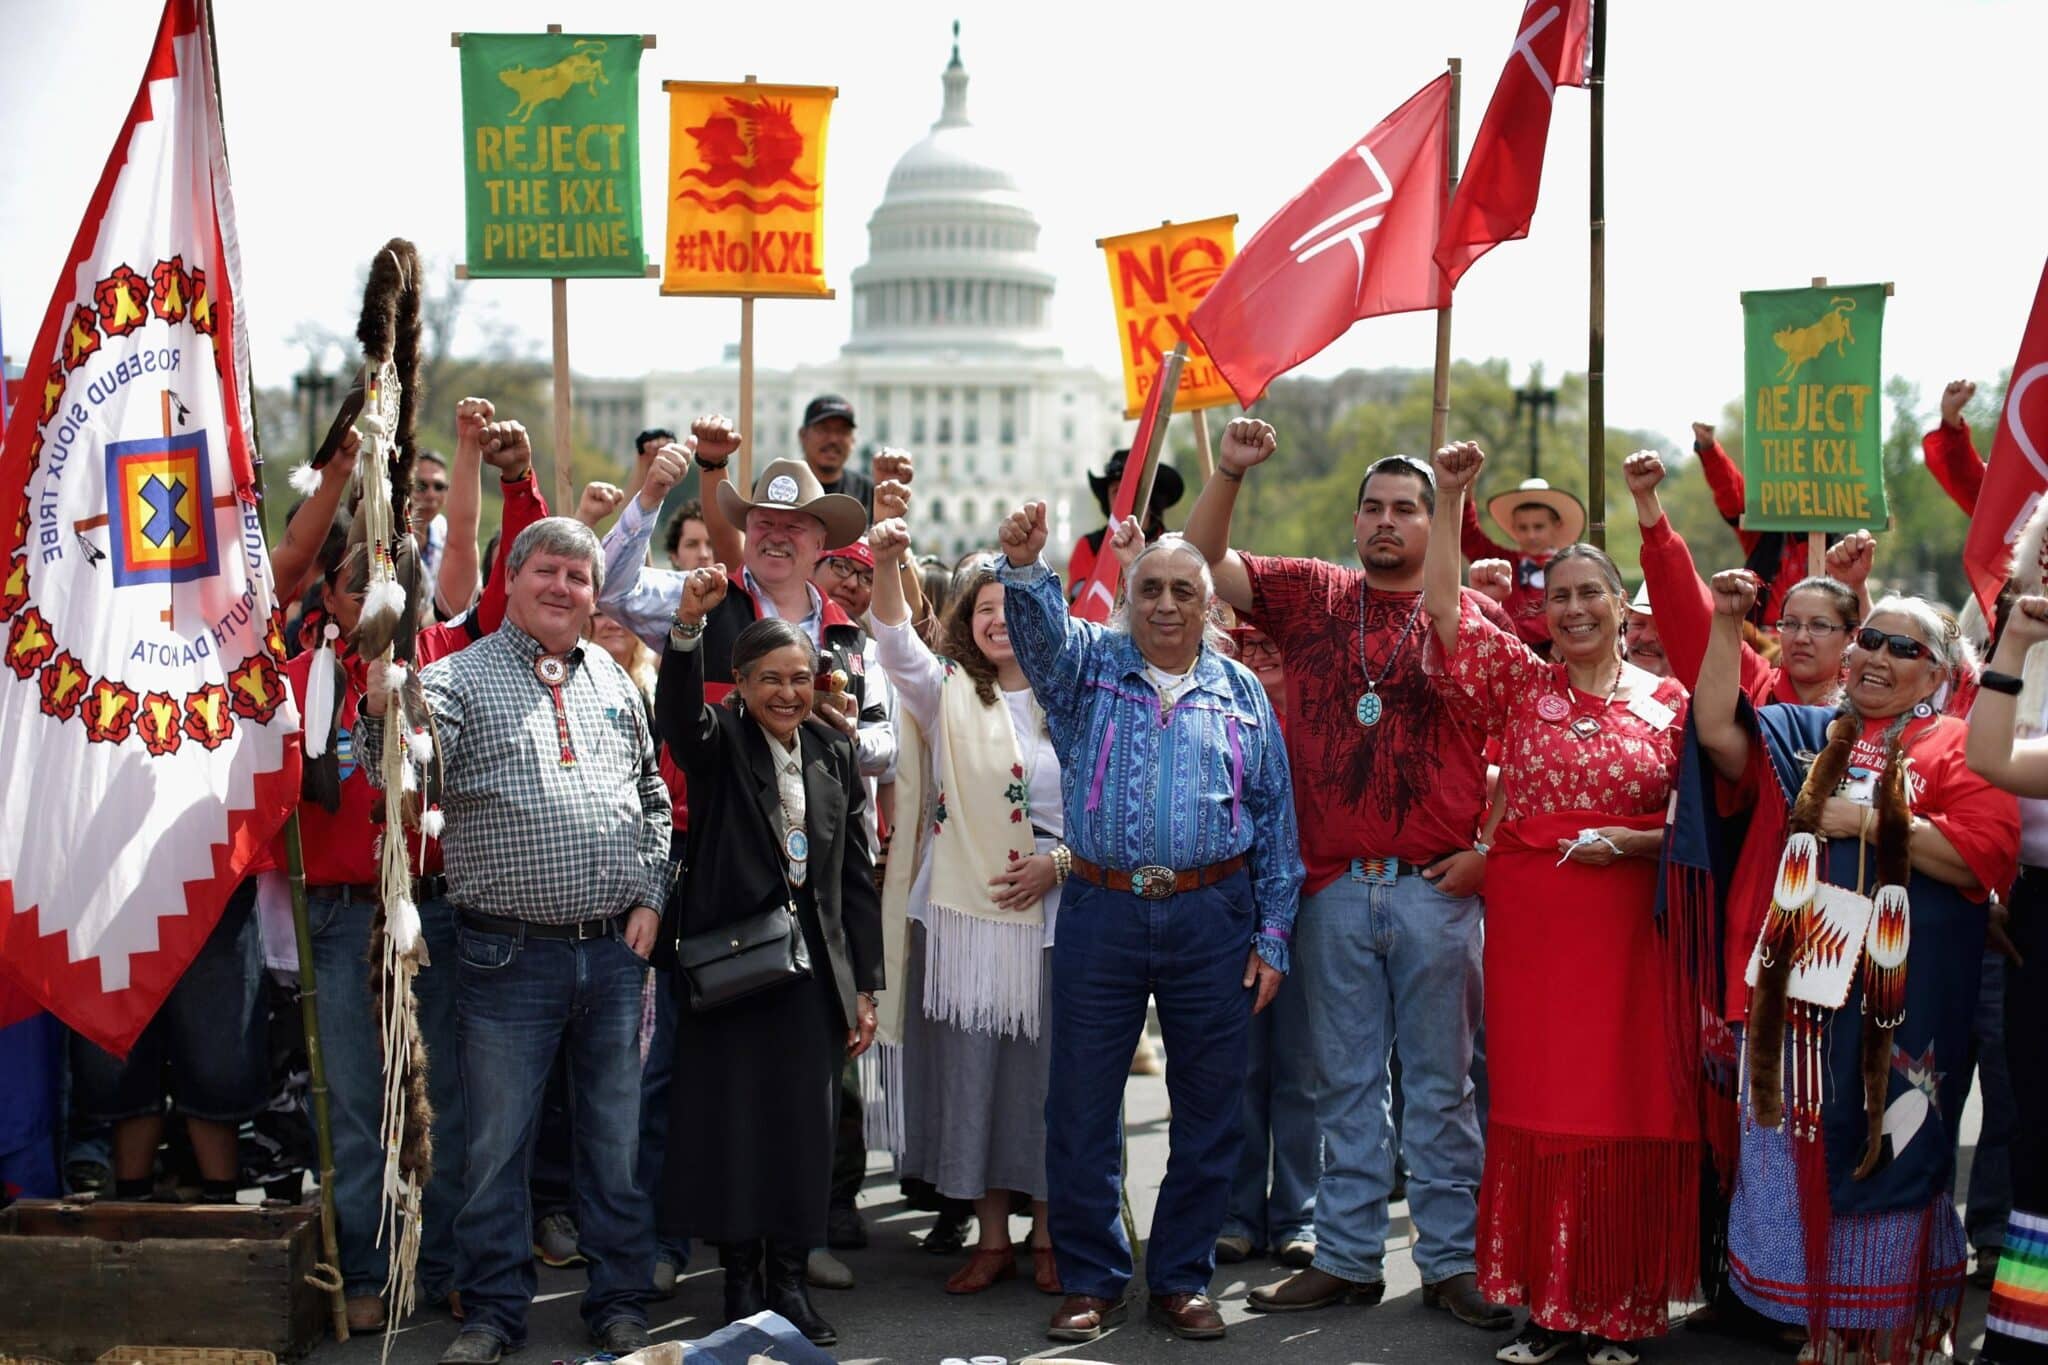
Members of the Cowboy and Indian Alliance, including Native Americans, farmers and ranchers from across the United States, begin a demonstration against the proposed Keystone XL pipeline in front of the U.S. Capitol April 22, 2014 in Washington, DC. Chip Somodevilla / Getty Images
The type of oil that TC Energy wants to transport from Alberta via the XL pipeline is known as tar sands, a thick-as-molasses oil due to a hydrocarbon substance called bitumen, which also contains a mixture of clay, sand and water. This type of oil is considered one of the dirtiest fossil fuels on the planet. Extracting it involves clearing large swaths of biodiverse boreal forest and using steam to liquefy the underground bitumen. All of this comes at a great cost to the environment and contributes to climate change, explaining why so many different groups are opposed to the project. Yet just as many groups have political and financial reasons to keep the Keystone XL pipeline alive.
Financial Motivators
For starters, the U.S. oil industry finds tar sands oil attractive because it means less of a reliance on oil from the Middle East, while the XL extension would prove cheaper than using rail transportation. Investors also want to protect their stake in the $8 billion pipeline.
Then there are other industry supporters, including the National Association of Manufacturers and construction unions, who have vested reasons for supporting claims that the pipeline would rely on renewable energy and achieve net-zero emissions by 2023, according to TC Energy. However, fully offsetting pipeline emissions wouldn’t help to reduce any of the emissions created by those using the actual tar sands oil.
The Global Energy Institute within the U.S. Chamber of Commerce supports Keystone XL because it claims the pipeline’s construction would provide more than 13,000 jobs to Americans and Canadians and generate $3.4 billion in U.S. GDP growth. That number also encompasses millions from state and local taxes. The Global Energy Institute has recently accused President Biden of making a politically motivated decision to cancel the pipeline, claiming that the pipeline would in fact protect the environment while boosting the domestic economy.
Yet there are valid claims that the refined tar sands oil wouldn’t even be sold in the U.S., but instead benefit the global market since Canada is free to sell the oil to anyone, all while the pipeline takes a toll on American land and water.
Not only that, but the State Department estimated that Keystone XL would ultimately create just 35 full-time jobs to operate the pipeline — so the thousands that are touted would be temporary jobs.
Political Motivators
The pipeline became caught in political crosshairs since it crosses the Canadian border, meaning TC Energy can’t proceed without a permit from the U.S. State Department.
Keystone XL has become highly politicized since its introduction in 2008, with democrats concerned about climate change (generally) opposing it and republicans who deny climate change (generally) supporting it. As mentioned in the timeline, former President Obama continually rejected the pipeline due to concerns about the rushed nature of environmental considerations. Later, former President Trump sought to immediately restore the Keystone XL project upon taking office: in part because his predecessor rejected it, and in part because of motivators that had more to do with maintaining economic reliance on the fossil fuel trade and less to do with worrying about climate change issues.
Ultimately, the real issue comes down to the environment.
How Does the Pipeline Impact the Environment and Society?
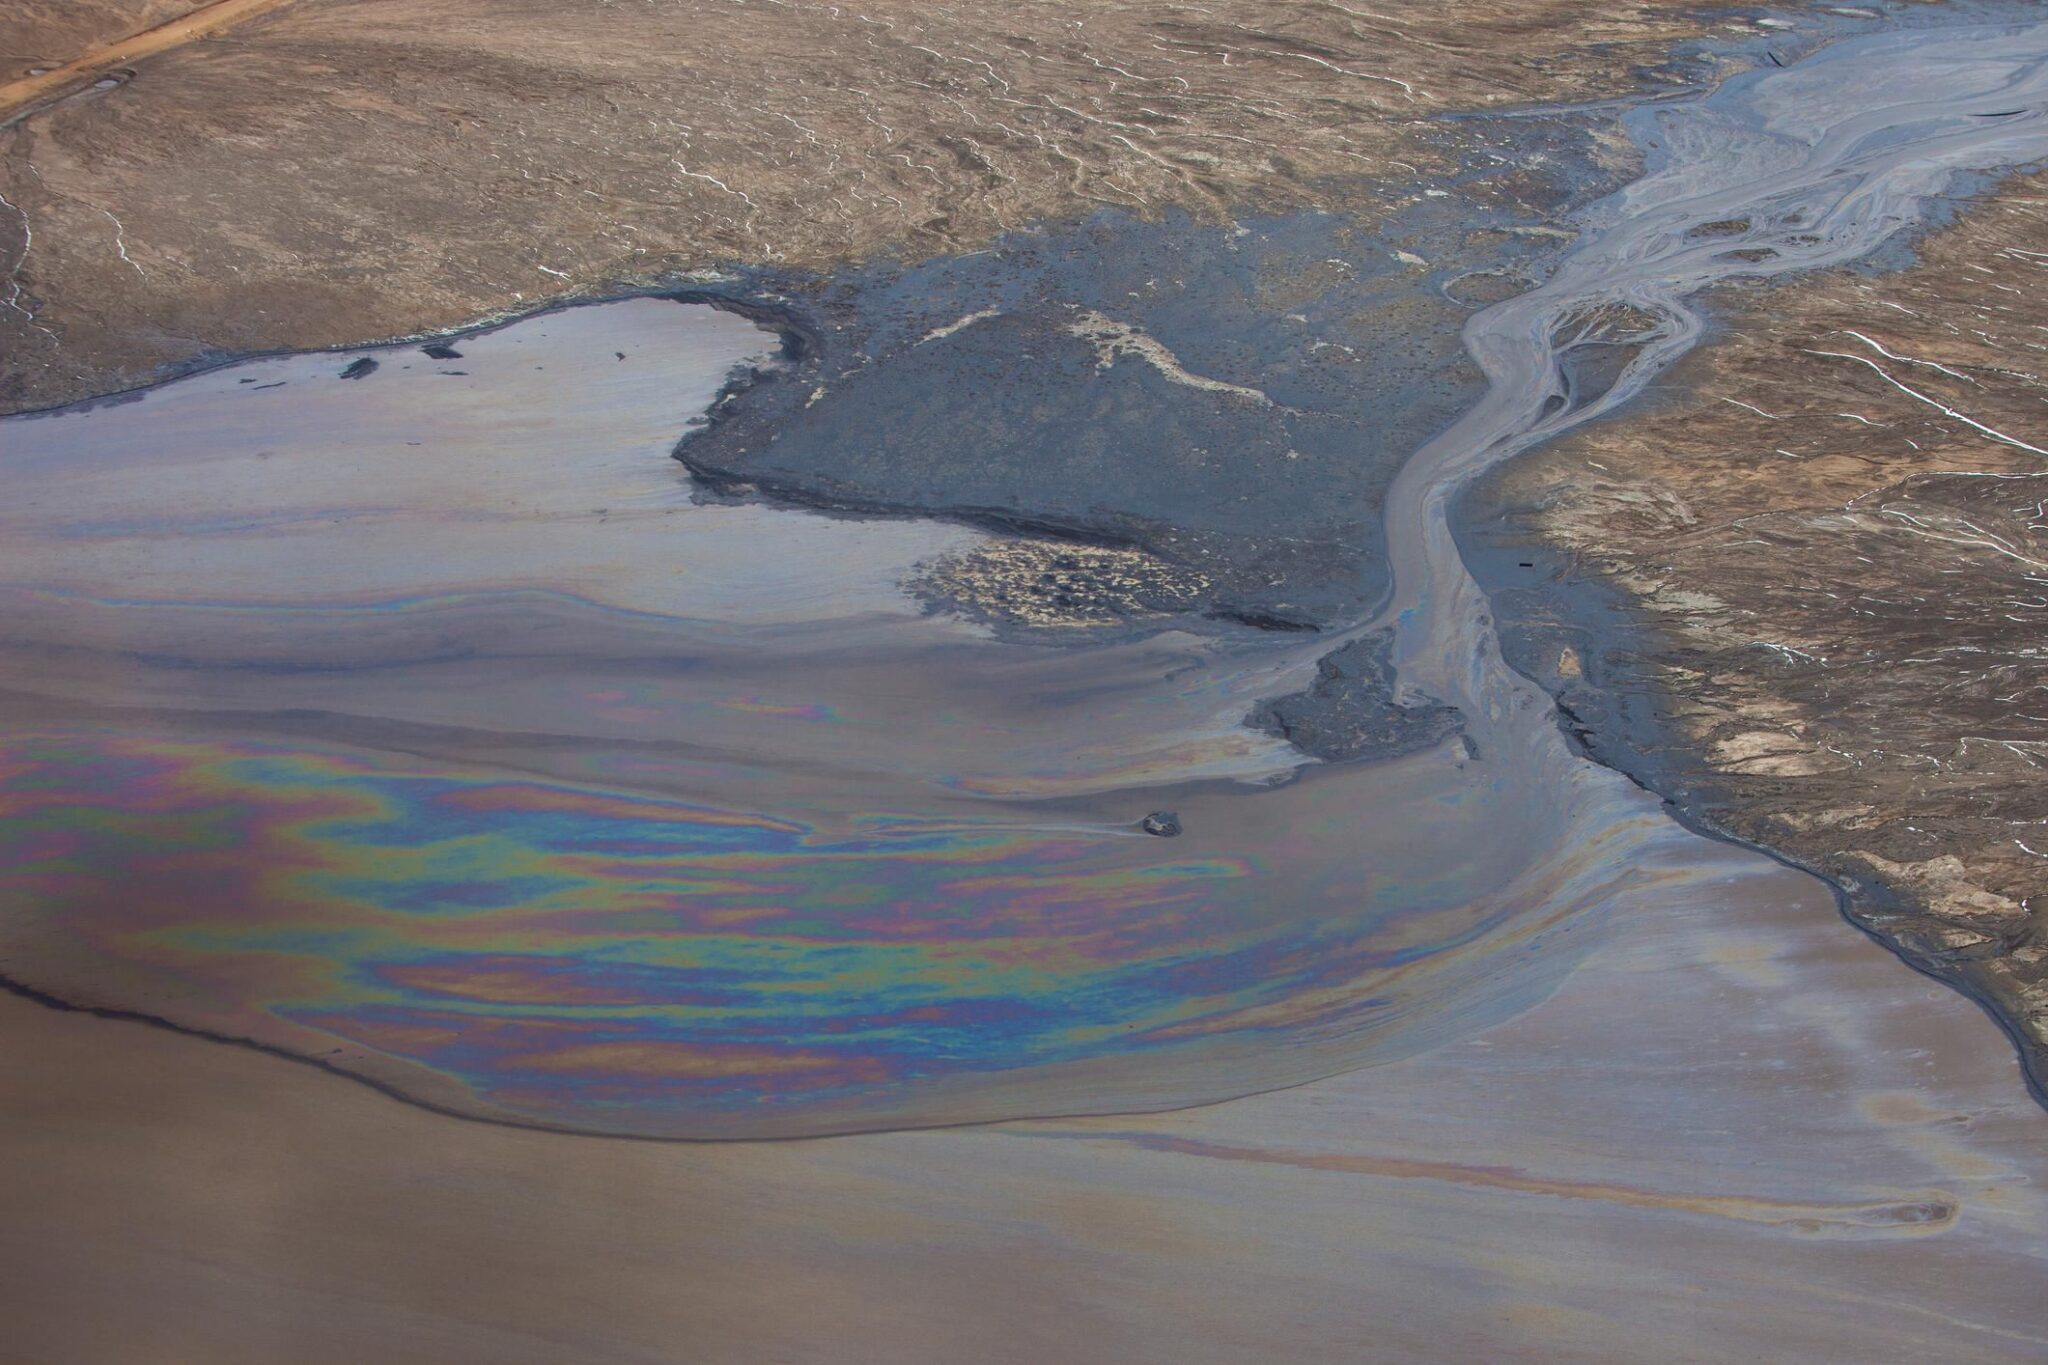
Heavy oil seen mixed with water in a tailings pond in the Alberta Oilsands. dan_prat / iStock / Getty Images
Tar Sands Oil
As previously touched upon, tar sands is not your average oil. Accessing it requires two different methods, neither of which is environmentally friendly. Both require water from the nearby Athabasca River in Alberta, taxing its finite quantities. The first method, involving surface mining, creates gallons of wastewater in the process. This wastewater is stored in “tailings ponds,” where the toxic water is more likely to leak into the environment. The other method involves pumping steam underground in order to access the needed bitumen through a well. This method also requires burning fossil fuels in the process. In fact, extracting tar sands oil produces more greenhouse gas emissions than extracting other natural resources.
Extraction methods aren’t the only environmental threat. Oil pipeline leaks and spills are very real dangers too. In 2010, a faulty pipeline carrying tar sands oil leaked 843,000 gallons into Michigan’s Kalamazoo River. Owned by Canadian-based Enbridge, the company’s slow response to stop the spill prompted area evacuations and permanently damaged the Talmadge Creek, the initial site of the spill. The incident is considered the largest inland oil spill to occur in the U.S. The U.S. Fish and Wildlife Service estimated that the oil damaged more than 1,560 acres of streams and rivers and negatively impacted at least 4,000 area animals that needed to be saved. Not only that, but removing bitumen from the environment is a far more costly and involved process than typical crude oil, itself a costly and involved process. Whereas crude oil floats on a surface, bitumen sinks.
Then there’s the matter of using tar sands oil itself as a fossil fuel. As it stands, burning the full amount that current technology is able to extract would contribute 22 billion metric tons of carbon to the atmosphere. The worst-case scenario predicts burning the maximum amount of tar sands oil that exists in Alberta would increase global warming by 0.4 degrees Celsius.
Indigenous Tribes
Parts of the proposed Keystone XL extension would run through or close to Indigenous territory, potentially threatening drinking water sources. There have already been oil leaks along existing parts of the Keystone pipeline, and the affected tribes, including the Assiniboine and Sioux Tribes of the Fort Peck Indian Reservation in Montana and the Cheyenne River Sioux Tribe of the Cheyenne River Reservation in South Dakota, have no reason to believe the extension would be any different. Besides the environmental dangers, the initial permits granted by the State Department ignored existing treaties between the government and Tribal Nations.
Farmers and Ranchers
Tribes aren’t the only ones whose rights and land have been threatened by the pipeline. Farms and ranches along the route have faced eminent domain, which would allow the government to take control of private land for public use; i.e., handing it over to TC Energy regardless of opposition. Nebraska has been a battleground state, with an estimated 92 percent of its land belonging to family-owned farms and ranches. Also at stake would be the Ogallala aquifer, an underwater supply that provides water to most of the state. If that’s contaminated by leaks, the ramifications would take a toll on public health, agriculture, livestock and wildlife. One study estimates that even a small leak could contaminate five billion gallons of water. It’s not just the tar-like bitumen that poses this danger; transporting sludgy tar sands oil requires carcinogenic chemicals to dilute it enough for pipelines.
Public Health
Tar sands oil poses additional hazards, both to local Alberta residents and those who live along the proposed route. Numerous studies have already linked higher cancer rates from polluted air and water in areas where people live near tar sands oil production or tar sand spills.
Wildlife
It’s not just the public who is at risk. For example, Nebraska is home to 20,000 acres of dunes and prairie hills known as Sandhills. It’s a popular pitstop for migrating sandhill cranes in particular. TC Energy’s proposed reroute would still cut straight through this region; a leak of any size could prove disastrous.
When Did the Pipeline Leak and Why?
Despite TC Energy touting an advanced leak detection system, the existing pipeline has leaked dozens of times since its inception in 2010, and locals have often been the first to notice and report many of them.
There were 35 leaks in the pipeline’s first year alone, including a 21,000-gallon spill impacting North Dakota. In 2016, about 16,800 gallons of oil leaked in South Dakota, but that was small compared to the following year, when 210,000 gallons spilled near the small town of Amherst, South Dakota. TC Energy later revised that number to 407,000 gallons of leaked oil. In 2019, an additional 378,000 gallons spilled in North Dakota.
Tar sands oil is more likely to leak than crude oil due to its corrosive nature and the high temperatures needed to transport it, and leaks are also much harder to detect. Not only that, but cleaning it up has proven to be a Herculean task. An NRDC report found that tar sand leaks are three times more likely than conventional crude oil. On top of that, a 2012 report revealed that leak detection systems missed 19 out of 20 leaks during a 10-year period. TC Energy itself admitted in 2011 that the company could only detect leaks greater than 500,000 gallons of tar sands a day.
As for what specifically caused all of the leaks to date? That depends, although variations of equipment failure is a recurring favorite. It’s still unknown what caused the massive 2019 leak in North Dakota.
What’s Being Done About Keystone XL?
After years of back and forth, President Biden, who ran on a more climate-friendly platform than his predecessor President Trump, canceled the pipeline on his first day in office on Jan. 21, 2021. But the case still isn’t closed. In response, 21 Republican-led states have since filed a lawsuit against Biden questioning his authority to make such a decision. (Nevermind that Trump overstepped his authority by issuing a 2019 presidential permit allowing the pipeline to proceed, thereby bypassing the required environmental reviews.)
Oil demand has also dropped since the pipeline’s initial proposal back in 2008, due in part to an economic shift toward clean energy and then decreased oil usage during the 2020 COVID pandemic. Plus early investors, including Shell and the Koch Brothers, have since pulled out of the deal. Though Keystone XL appears to have reached the end of the line, opponents say the final step involves removing the existing pipeline infrastructure.
Takeaway
The canceled Keystone XL pipeline is a promising step toward a less oil-reliant future, but it’s still a step. There remain other controversial pipelines caught up in legal battles, most notably the Dakota Access pipeline and Enbridge’s Line 3 replacement project. Resolving the ongoing oil pipeline threat ultimately requires a continued push toward clean energy, thereby eliminating the need for pipelines in the first place.
Meredith Rosenberg is a senior editor at EcoWatch. She holds a Master’s from the Newmark Graduate School of Journalism in NYC and a B.A. from Temple University in Philadelphia.