
 568k
568k  233k
233k  41k
41k  Subscribe

Pexels
MCT oil is a supplement touted for its benefits, which may include weight loss, increased energy and improved cognitive function. MCT, which stands for medium chain triglyceride, contains saturated fatty acids that can be broken down quickly for energy when compared to poly- and monounsaturated fatty acids. Some food sources are coconut oil, palm kernel oil, and goat’s milk.
There are four types of MCT:
- C6: caproic acid or hexanoic acid
- C8: caprylic acid or octanoic acid (most common in supplements)
- C10: capric acid or decanoic acid (most common in supplements)
- C12: lauric acid or dodecanoic acid (mainly found in coconut oil)
According to a study published in the Journal of Lipid Research, MCT oil enters the cell quickly and may be used as a quick source of energy with a lower likelihood of being stored as body fat. Another benefit of MCT oil may also be weight loss, according to a study published in the Journal of the Academy of Nutrition and Dietetics (JAND).
It’s also popular with those on a ketogenic diet as it increases the amount of ketones the body has available to use for energy. MCT oil has grown in popularity due to the fame of “bulletproof” coffee, which claims to support brain function. But MCT oil can also be used in salad dressings if you want the energy-boosting effects without the coffee.
What You Need to Know
When shopping for MCT oil, it is important to review the ingredient label and make sure the MCT oil is derived from organic coconuts as this form is more easily digested. Most MCT oils come in liquid form, but MCT oil powder is also available. Also, avoid purchasing MCT oil containing caproic acid (C6), as it is foul-tasting and potentially abrasive on your digestive system. Caproic acid has poor bioavailability and may lead to gas, bloating or diarrhea, as well as stomach upset.
Why Would You Use MCT Oil?
MCT oil containing C8 and C10 is a smart choice if you are looking for sustained energy during workouts or for when you have a long work day, as well as those on a keto diet. It can also be used in your morning coffee. Due to the potential fat-burning benefits, it may help your metabolism burn calories more efficiently throughout the day. MCT oil can also be used in cooking, as saturated fats oxidize more slowly than unsaturated fats. The slower oxidation of saturated fats may reduce the creation of cancer-causing molecules during the cooking process.
Each product featured here has been independently selected by the writer. If you make a purchase using the links included, we may earn commission.
The Best MCT Oils Available Online
Best for Athletic Performance: Sports Research Premium MCT Oil

Amazon
With its high amount of C8 (caprylic acid), Sports Research Premium MCT is a great choice for athletes and avid gym-goers alike. C8’s enhanced ability to increase your body’s ketone production may lead to better endurance, focus and strength during bouts of activity.
Why Buy: Non-GMO; Certified Paleo; Great for athletes and gym-goers
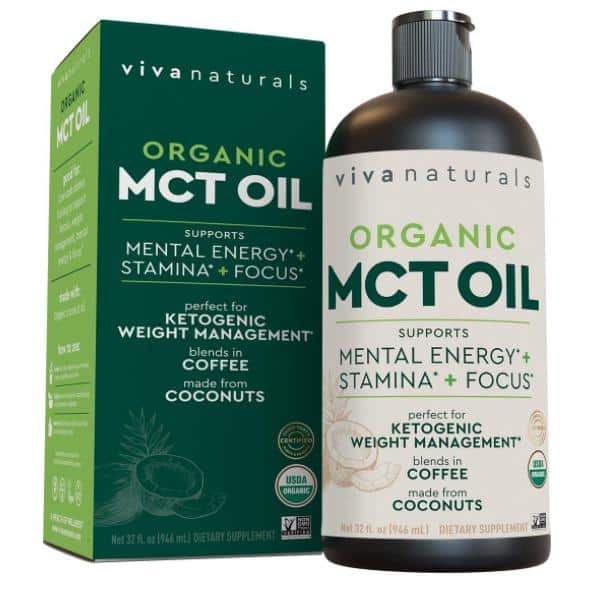
Viva Naturals Organic MCT Oil
Amazon
Made from 100% coconuts, Viva Naturals MCT Oil contains three types of MCT which include caprylic, capric and lauric acids. These different forms have individual benefits which may include improved memory recall, blood sugar support and increase energy. This oil is also easily blendable in shakes, smoothies and a great addition to a morning cup of coffee.
Why Buy: USDA certified organic; Third-party tested; Paleo
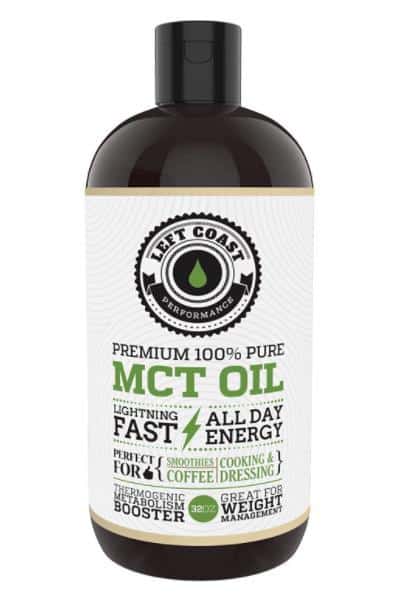
Left Coast Performance MCT Oil
Amazon
With their efficient distribution process, Left Coast Performance MCT Oil ensures the consumer receives the freshest MCT oil, which may improve the efficacy of the product. Due to being derived from coconuts rather than palm kernel oil, it also ensures easier digestibility, which may lead to enhanced bioavailability.
Why Buy: Made with sustainably-sourced coconuts; May enhance metabolism; GMP certified; Vegan
Diving Deeper: MCT Oil vs Coconut Oil
For Energy
MCTs can increase energy and physical stamina for exercise, and because it’s so easy to digest, MCT oil can boost energy faster than most nutrients. Coconut oil, on the other hand, takes longer for the body to break down and is a better source of slow-burning energy.
In a 2009 study, two weeks of MCT oil supplementation effectively improved the endurance of recreational athletes in high-intensity exercise. MCT oil also increased fat loss and reduced blood lactate levels. In a Japanese study, MCT oil significantly improved swimming endurance in mice after six weeks of supplementation.
For Stress and Anxiety
Coconut oil and MCT oil may help reduce stress and anxiety. Both supply anti-inflammatory nutrients to the brain and can make you more clear-headed and less stressed. Coconut oil is rich in polyphenols and healthy HDL cholesterol, making it an ideal superfood for the nervous system.
Here’s what the research has to say about stress, anxiety, and MCTs:
- In mice forced to swim until exhaustion and withstand frigid temperatures, oral coconut oil was found to reduce adrenal weight, increase brain antioxidants, and shorten recovery times in a recent study.
- At the same time, a 2018 rodent study found that “(coconut oil) can ameliorate the effects of stress on anxiety-like behavior and episodic-like memory in young rats.”
- A separate study published in the journal Neuropharmacology concluded that a diet high in MCTs can exert anti-anxiety effects.
For Digestion
Both coconut oil and MCT oil can support the digestive system by balancing bacteria in the gut. The body relies heavily on gut bacteria to reinforce the gut lining, fight inflammation, produce serotonin, and support mental health.
MCTs can also help the body absorb fat-soluble nutrients like:
- Beta-carotene
- Lutein
- Vitamine E
- Phosphorus
- Magnesium
- Calcium
According to a study published in the Journal of Nutritional Biochemistry, researchers found that medium chain triglycerides can exhibit stronger antimicrobial effects than long chain triglycerides.
When added to human milk, infant formula, and cow’s milk, MCTs were significantly more effective than long chain monoglycerides at inactivating pathogens for herpes, influenza, and streptococcus.
For Appetite Suppression
MCTs may suppress appetite by enhancing thermogenesis and increasing ketone production. Ketones, as it turns out, suppress ghrelin (the hunger hormone) and increase cholecystokinin (CCK), which makes you feel full.
In a 2014 study published in the European Journal of Clinical Nutrition, researchers tested the effectiveness of MCTs to reduce food intake in overweight men. They found that “MCT consumption reduced food intake acutely.”
Coconut oil may also be mildly effective at suppressing appetite.
In a 2015 study involving women with excess body fat, researchers determined that virgin coconut oil consumption “did not acutely change energy metabolism and cardiometabolic risk markers when added to a mixed breakfast but promoted less appetitive responses.”
For Weight Loss
In addition to suppressing appetite, MCT oil may promote weight loss by boosting cellular metabolism and fat burning. Although it’s far from a miracle weight loss solution, studies show that MCT oil may support certain metabolic functions related to weight loss.
Here’s what researchers have discovered about MCT oil and weight loss:
- One rodent study in the American Journal of Clinical Nutrition found that “overfeeding MCT diet results in decreased body fat related to increased metabolic rate and thermogenesis.”
- In a human study published in the Journal of Nutrition, adults were given either medium chain fatty acids or long chain fatty acids for a 12-week period. Decreases in body fat and weight were significantly greater in the MCT group.
- A 27-day study compared the effects of MCT vs. LCT consumption on body composition and fat oxidation in obese women. The MCT group lost significantly more weight than the LCT group.
However, according to a 2017 report in the European Journal of Clinical Nutrition, coconut oil does not exert any obvious effects on weight loss.
MCTs and the Ketogenic Diet
MCT oil and coconut oil work great with the ketogenic diet: a high-fat, low-carb diet where the body uses ketones instead of glucose as its primary fuel source. When you take high-quality MCT oil, the liver converts it into ketones in minutes, and unlike glucose, ketones can immediately cross the blood-brain barrier to support brain function.
A 2018 study found that the ketogenic diet and medium-chain triglycerides can increase brain metabolism in patients with Alzheimer’s disease.
Being in ketosis is also an effective way to reduce inflammation, boost fat oxidation, and lower blood sugar. Most nutritionists recommend following the keto diet for short periods of one to three months. This gives the body adequate time to restore gut bacteria and relieve chronic inflammation.
In Conclusion
MCT oil is a supplement touted for its health benefits. When shopping, try to find products that source ingredients from sustainable sources or go the extra mile to get certified as organic. And, as with any health decision, it’s important to think first about your personal goals, then talk to a qualified healthcare professional or nutritionist to make a place that’s right for you.
Jaclyn Jacobsen, MS is a Functional Nutritionist, freelance writer and founder of Lifestyle Nutrition. She has been in private practice for over 4 years and has extensive experience in community nutrition and the supplement industry. She earned a graduate degree in Nutrition, Dietetics and Education from Montclair State University. She has supported countless individuals in the areas of stress management, inflammation, weight management, fitness and hormonal health. Jaclyn has also worked within the eating disorder community, supporting women in resolving disordered eating behaviors, body dysmorphia and healing their relationships with food. She has applied her health and wellness knowledge through writing contributions and features in Greatist.com, Livestrong.com, and GoodHousekeeping.com.
- Top 10 Evidence-Based Health Benefits of Coconut Oil - EcoWatch
- What Is Fractionated Coconut Oil Good For? - EcoWatch